Technical Analysis of SHDG 2024-05-10
Overview:
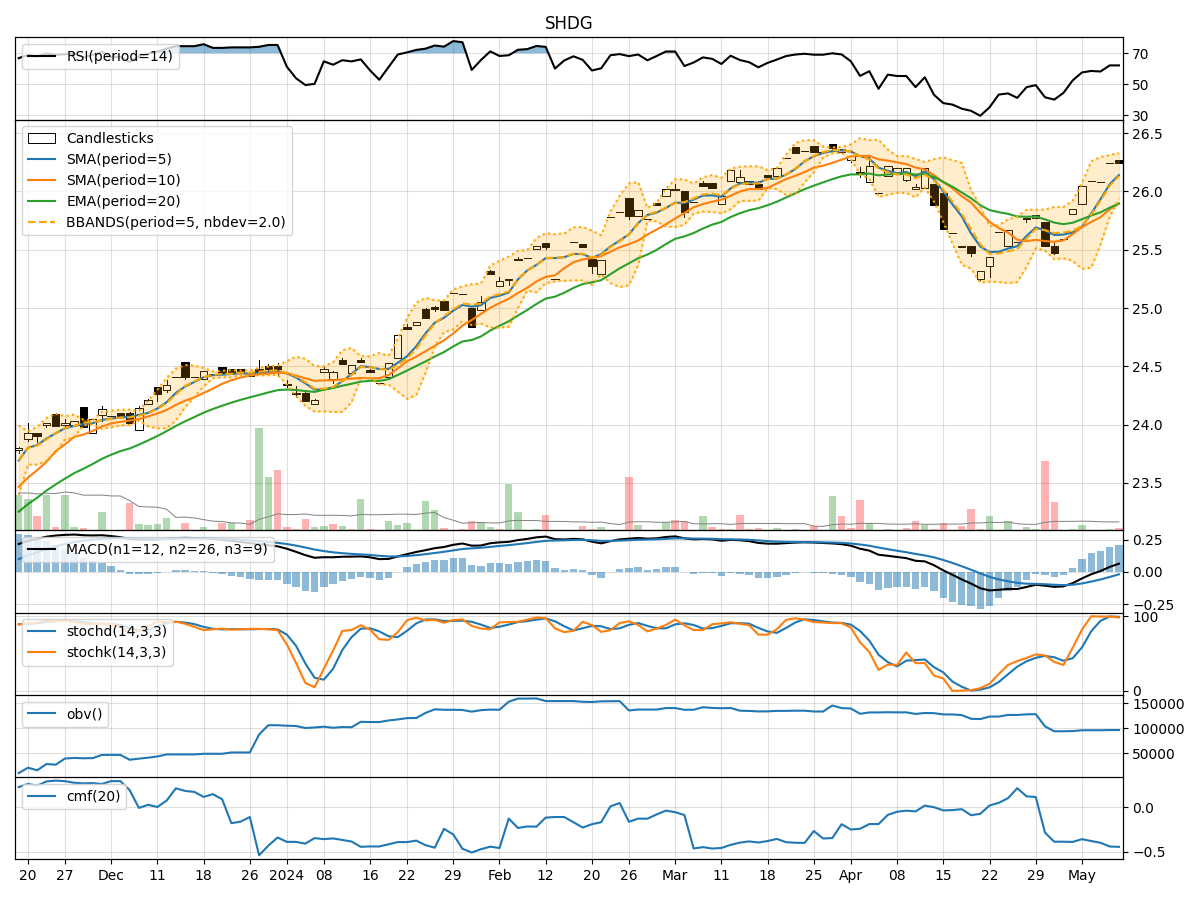
In analyzing the technical indicators for SHDG over the last 5 days, we will delve into the trend, momentum, volatility, and volume indicators to provide a comprehensive outlook on the possible stock price movement. By examining these key aspects, we aim to offer valuable insights and predictions for the upcoming days.
Trend Analysis:
- Moving Averages (MA): The 5-day Moving Average (MA) has been consistently above the Simple Moving Average (SMA) and Exponential Moving Average (EMA), indicating a bullish trend.
- MACD: The Moving Average Convergence Divergence (MACD) has shown positive values, with the MACD line consistently above the Signal line, suggesting bullish momentum.
- RSI: The Relative Strength Index (RSI) has been in the range of 50-70, indicating a moderate bullish sentiment.
Momentum Analysis:
- Stochastic Oscillator: The Stochastic Oscillator has been in the overbought region, suggesting a strong bullish momentum.
- Williams %R: The Williams %R has been consistently below -20, indicating an overbought condition.
Volatility Analysis:
- Bollinger Bands: The Bollinger Bands have shown a narrowing of the bands, indicating decreasing volatility.
- Volatility Percentage (BBP): The Bollinger Bands Percentage (BBP) has been fluctuating around 0.8, suggesting moderate volatility.
Volume Analysis:
- On-Balance Volume (OBV): The OBV has shown a slight decrease, indicating some selling pressure.
- Chaikin Money Flow (CMF): The CMF has been negative, suggesting a bearish money flow.
Key Observations:
- The trend indicators point towards a bullish sentiment, supported by positive MACD values and MA positioning.
- Momentum indicators indicate a strong bullish momentum, with overbought conditions in Stochastic and Williams %R.
- Volatility has been decreasing, as shown by the narrowing Bollinger Bands.
- Volume indicators suggest a slight selling pressure, with a negative CMF.
Conclusion:
Based on the analysis of the technical indicators, the stock price of SHDG is likely to continue its upward movement in the next few days. The bullish trend, strong momentum, decreasing volatility, and moderate selling pressure indicate a favorable outlook for the stock. Traders and investors may consider buying opportunities in anticipation of further price appreciation.