Technical Analysis of SHOC 2024-05-10
Overview:
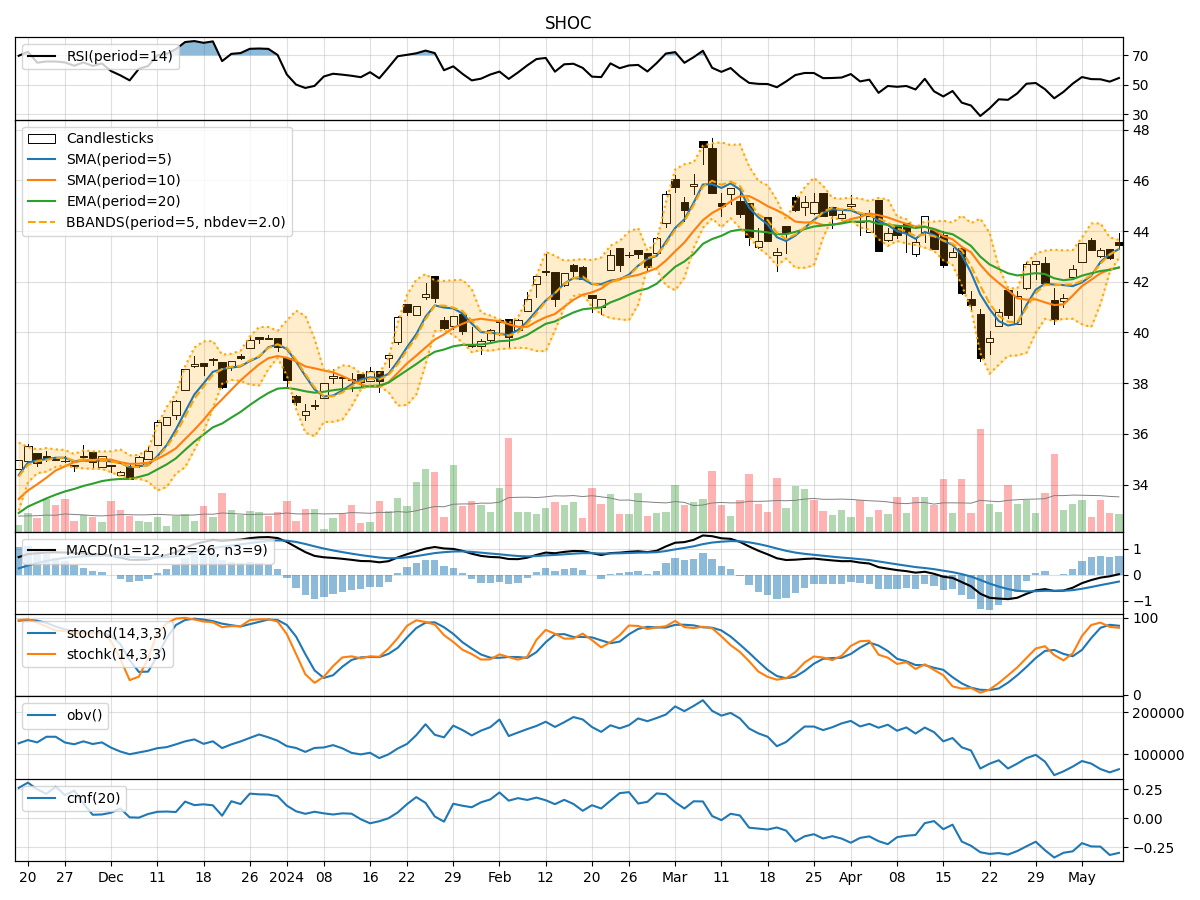
In analyzing the technical indicators for SHOC stock over the last 5 days, we will delve into the trend, momentum, volatility, and volume indicators to provide a comprehensive outlook on the possible stock price movement in the coming days. By examining these key indicators, we aim to offer valuable insights and predictions to guide investment decisions.
Trend Analysis:
- Moving Averages (MA): The 5-day Moving Average (MA) has been trending upwards, indicating a positive momentum in the stock price.
- MACD: The Moving Average Convergence Divergence (MACD) has shown a positive trend with the MACD line consistently above the signal line.
- EMA: The Exponential Moving Average (EMA) has been steadily increasing, reflecting a bullish sentiment in the market.
Momentum Analysis:
- RSI: The Relative Strength Index (RSI) has been fluctuating around the neutral level, suggesting a balanced momentum in the stock.
- Stochastic Oscillator: Both %K and %D values have been in the overbought territory, indicating a potential reversal or consolidation phase.
- Williams %R: The Williams %R indicator has been hovering in the oversold region, signaling a possible buying opportunity.
Volatility Analysis:
- Bollinger Bands: The Bollinger Bands have shown a narrowing of the bands, indicating decreasing volatility and a potential price breakout in the near future.
- Bollinger %B: The %B indicator has been fluctuating within a range, suggesting a period of consolidation in the stock price.
Volume Analysis:
- On-Balance Volume (OBV): The OBV indicator has been declining, indicating a divergence between price and volume, which could signal a potential trend reversal.
- Chaikin Money Flow (CMF): The CMF has been negative, reflecting selling pressure in the stock.
Conclusion:
Based on the analysis of the technical indicators, the stock price of SHOC is likely to experience sideways movement in the next few days. The trend indicators suggest a bullish bias with the moving averages and MACD pointing towards a positive momentum. However, the momentum indicators show signs of overbought conditions, which could lead to a period of consolidation or a minor pullback in the stock price. The volatility indicators indicate a potential breakout due to the narrowing Bollinger Bands, while the volume indicators suggest a bearish sentiment with declining OBV and negative CMF.
In conclusion, while the overall trend remains positive, investors should exercise caution due to the overbought momentum and negative volume signals. It is advisable to closely monitor the price action and key support/resistance levels for potential entry or exit points in the stock.