Technical Analysis of SHPP 2024-05-10
Overview:
In analyzing the technical indicators for SHPP over the last 5 days, we will delve into the trend, momentum, volatility, and volume indicators to provide a comprehensive outlook on the possible stock price movement. By examining these key indicators, we aim to offer valuable insights and predictions for the upcoming days.
Trend Analysis:
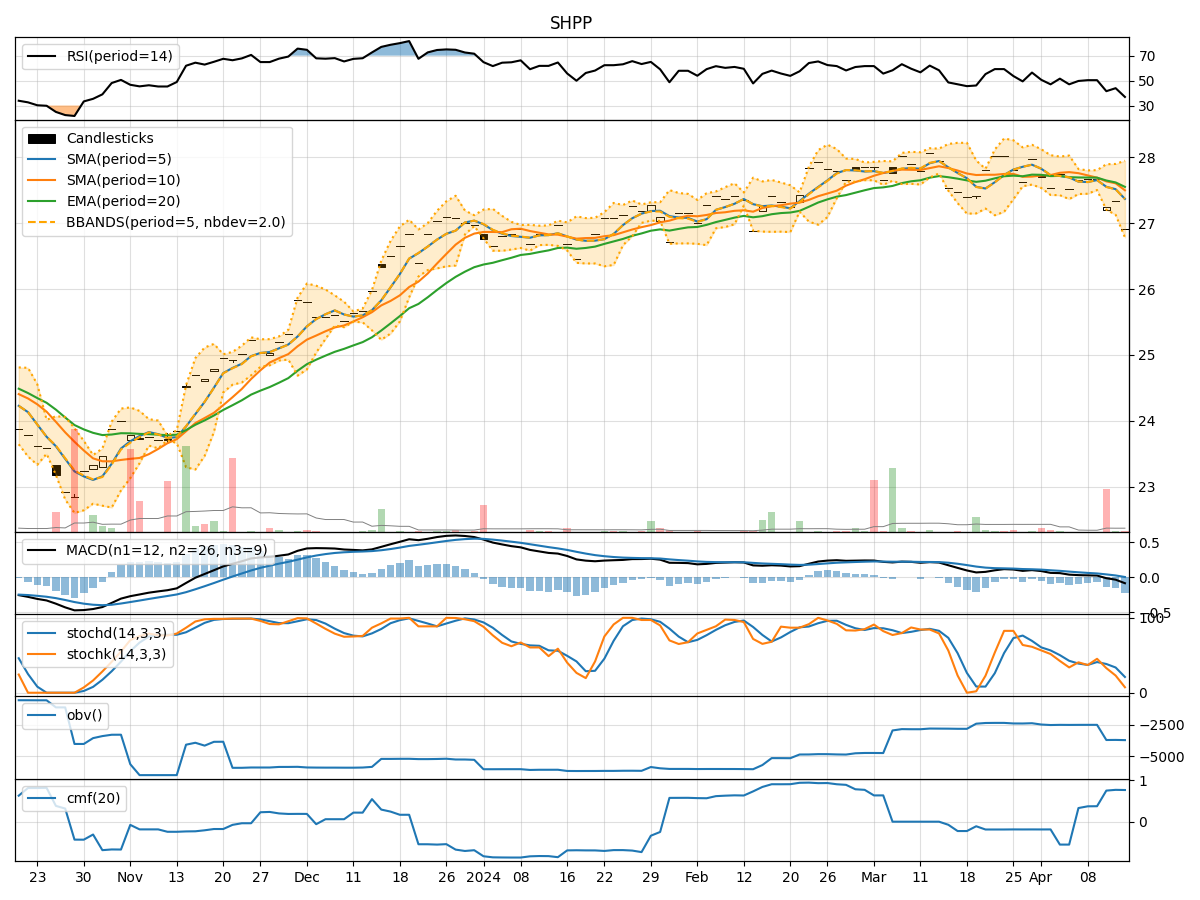
- Moving Averages (MA): The moving averages show a consistent uptrend over the last 5 days, with the closing price consistently above the short-term moving averages.
- MACD: The MACD line has been negative but showing signs of convergence towards the signal line, indicating a potential reversal in the trend.
- RSI: The RSI has been gradually increasing, suggesting strengthening bullish momentum.
Momentum Analysis:
- Stochastic Oscillator: Both %K and %D values are in the overbought territory, indicating a potential reversal or consolidation in the near future.
- Williams %R: The Williams %R is in the oversold region, signaling a potential buying opportunity.
Volatility Analysis:
- Bollinger Bands: The price has been trading within the Bollinger Bands, indicating a period of consolidation. The bands are relatively narrow, suggesting low volatility.
- Bollinger %B: The %B indicator is hovering around the middle range, indicating a balanced market sentiment.
Volume Analysis:
- On-Balance Volume (OBV): The OBV has been relatively stable, indicating a neutral volume flow.
- Chaikin Money Flow (CMF): The CMF has been negative, suggesting a bearish money flow trend.
Key Observations:
- The trend indicators suggest a potential reversal or consolidation in the stock price movement.
- Momentum indicators show conflicting signals, with stochastic oscillator indicating overbought conditions and Williams %R signaling oversold conditions.
- Volatility indicators point towards a period of consolidation with low volatility.
- Volume indicators reflect a neutral volume flow with a bearish money flow trend.
Conclusion:
Based on the analysis of the technical indicators, the stock price of SHPP is likely to experience sideways movement or consolidation in the next few days. The conflicting signals from momentum indicators and the stable volume flow suggest a lack of clear direction in the near term. Traders may consider adopting a cautious approach and closely monitor key support and resistance levels for potential breakout opportunities.