Technical Analysis of SHRT 2024-05-10
Overview:
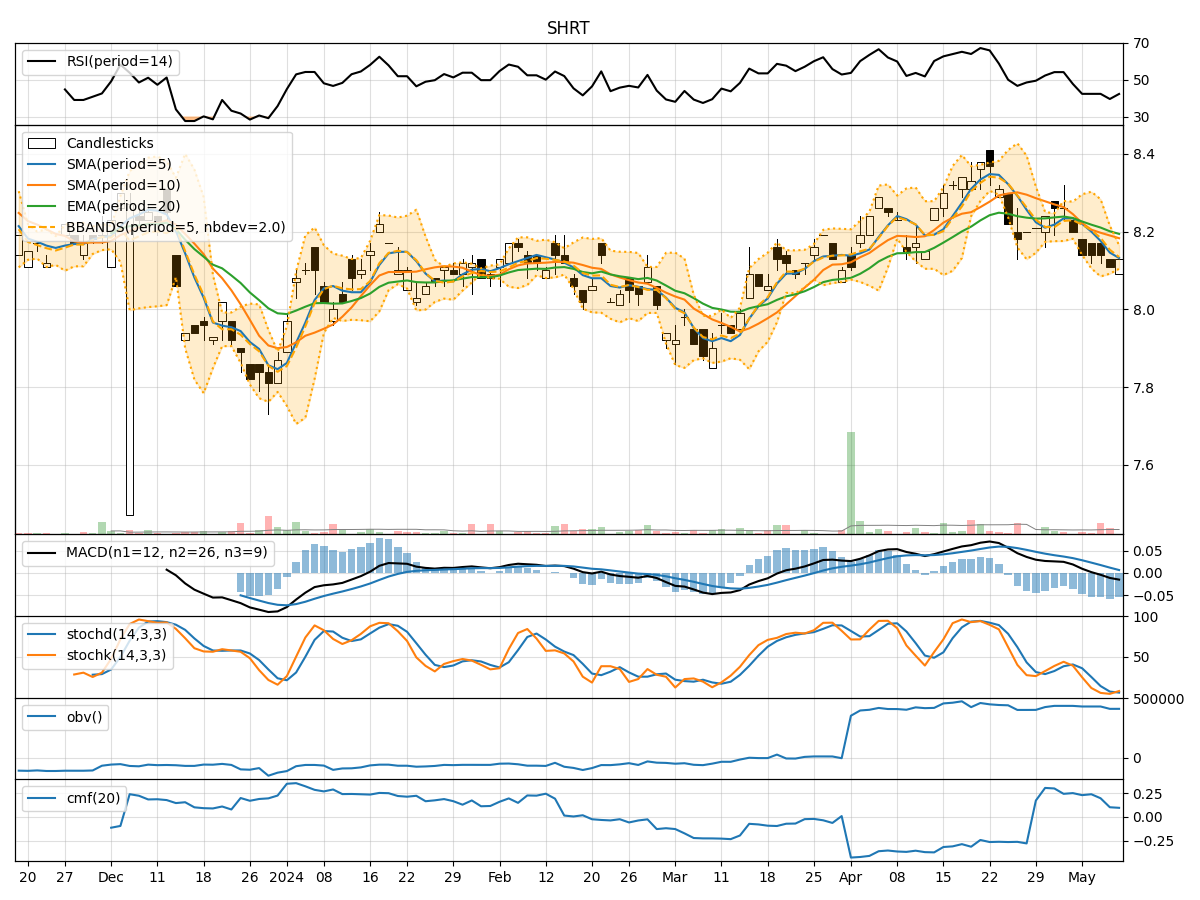
In analyzing the technical indicators for the stock SHRT over the last 5 days, we will delve into the trends, momentum, volatility, and volume indicators to provide a comprehensive outlook on the possible stock price movement in the coming days. By examining key metrics such as moving averages, MACD, RSI, Bollinger Bands, and OBV, we aim to offer valuable insights and recommendations for potential trading strategies.
Trend Indicators:
- Moving Averages (MA): The 5-day MA has been consistently below the closing price, indicating a short-term downtrend.
- MACD: The MACD line has been decreasing, with the MACD histogram also showing a downward trend, suggesting weakening momentum.
- EMA: The EMA has been declining, further supporting the bearish sentiment in the short term.
Momentum Indicators:
- RSI: The RSI has been hovering around 40-42, indicating a neutral stance with a slight bearish bias.
- Stochastic Oscillator: Both %K and %D have been in oversold territory, signaling a potential reversal or consolidation phase.
- Williams %R: The indicator has been fluctuating in the oversold region, suggesting a possible reversal in the near future.
Volatility Indicators:
- Bollinger Bands: The bands have been narrowing, indicating decreasing volatility and a potential period of consolidation.
- Bollinger %B: The %B value has been fluctuating around 0.2-0.3, suggesting a lack of strong directional momentum.
- Bollinger Band Width: The band width has been contracting, signaling a potential breakout or significant price movement ahead.
Volume Indicators:
- On-Balance Volume (OBV): The OBV has been relatively flat, indicating a balance between buying and selling pressure.
- Chaikin Money Flow (CMF): The CMF has been decreasing, reflecting a decline in buying pressure and potential distribution phase.
Conclusion:
Based on the analysis of the technical indicators, the stock SHRT is likely to experience further downside movement in the coming days. The trend indicators, momentum oscillators, and volatility measures all point towards a bearish outlook, with signs of consolidation and lack of strong buying interest. Traders should exercise caution and consider shorting or staying on the sidelines until clearer signals of a trend reversal or bullish momentum emerge. It is advisable to closely monitor key support levels and wait for confirmation of a trend reversal before considering long positions.