Technical Analysis of SHUS 2024-05-10
Overview:
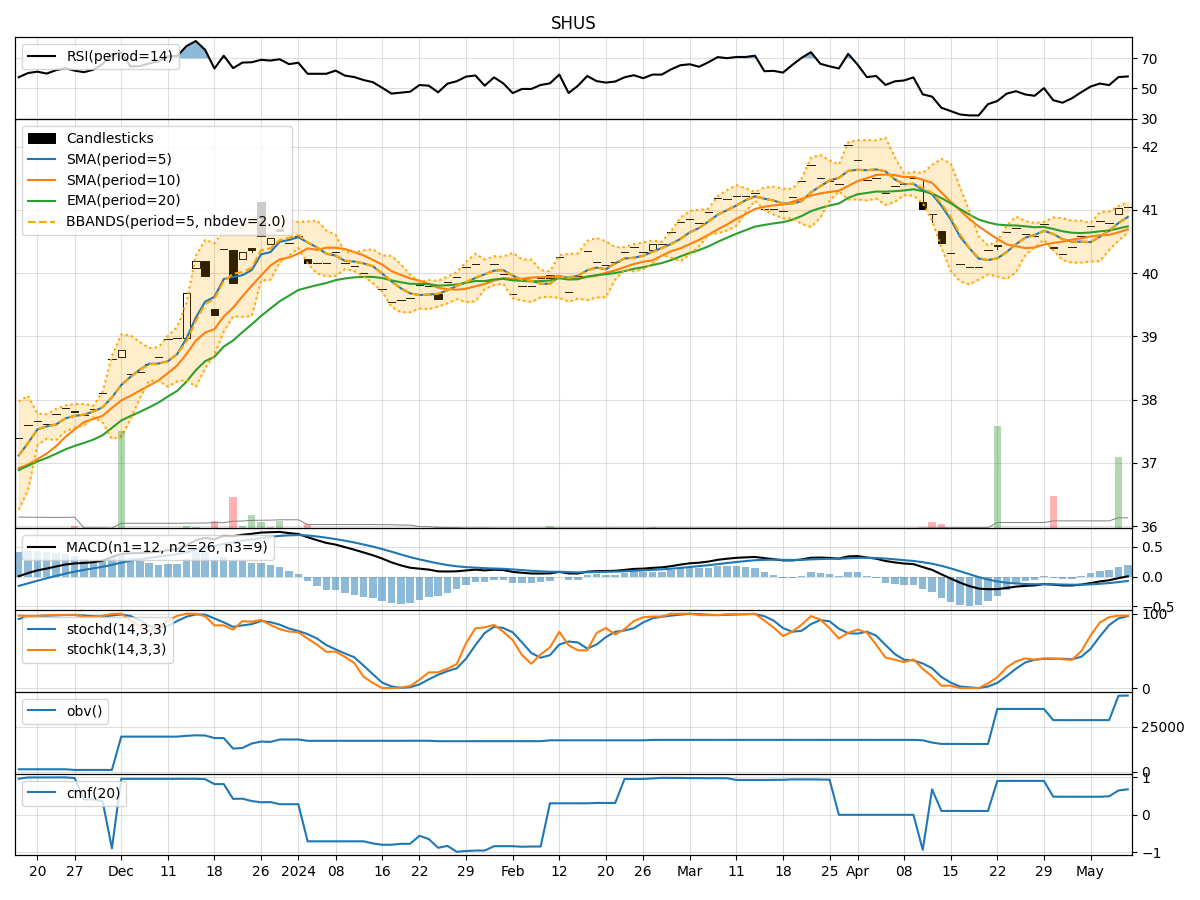
In analyzing the technical indicators for SHUS over the last 5 days, we will delve into the trend, momentum, volatility, and volume indicators to provide a comprehensive outlook on the possible stock price movement in the coming days. By examining these key indicators, we aim to offer valuable insights and predictions for potential investors and traders.
Trend Indicators:
- Moving Averages (MA): The moving averages show a gradual increase over the last 5 days, indicating a positive trend in the stock price.
- MACD (Moving Average Convergence Divergence): The MACD and its signal line are both in positive territory, suggesting bullish momentum.
- EMA (Exponential Moving Average): The EMA also shows an upward trend, supporting the positive momentum in the stock.
Momentum Indicators:
- RSI (Relative Strength Index): The RSI is above 50, indicating bullish momentum in the stock.
- Stochastic Oscillator: Both %K and %D are in the overbought zone, signaling a potential reversal or consolidation.
- Williams %R (Willams Percentage Range): The Williams %R is also in the oversold territory, suggesting a possible reversal in the stock price.
Volatility Indicators:
- Bollinger Bands: The Bollinger Bands are widening, indicating increased volatility in the stock price.
- Bollinger %B: The %B is below 1, suggesting that the stock price is trading below the lower Bollinger Band, potentially indicating an oversold condition.
Volume Indicators:
- On-Balance Volume (OBV): The OBV has been increasing over the last 5 days, indicating accumulation of the stock.
- Chaikin Money Flow (CMF): The CMF is positive, suggesting that money is flowing into the stock.
Key Observations and Opinions:
- Trend: The stock is in an upward trend based on moving averages and MACD.
- Momentum: The momentum indicators suggest a bullish bias in the short term.
- Volatility: Increased volatility could lead to short-term fluctuations in the stock price.
- Volume: The rising OBV and positive CMF indicate buying interest in the stock.
Conclusion:
Based on the analysis of the technical indicators, the next few days for SHUS are likely to see further upward movement in the stock price. The positive trend, bullish momentum, and buying interest indicated by volume indicators suggest that the stock may continue its upward trajectory. However, traders should be cautious of potential reversals indicated by overbought conditions in the stochastic oscillator and Williams %R. Overall, the outlook for SHUS appears bullish in the near term.