Technical Analysis of SIFI 2024-05-10
Overview:
In analyzing the technical indicators for SIFI stock over the last 5 days, we will delve into the trend, momentum, volatility, and volume indicators to provide a comprehensive outlook on the possible stock price movement in the coming days. By examining these key indicators, we aim to offer valuable insights and predictions for potential investors.
Trend Indicators:
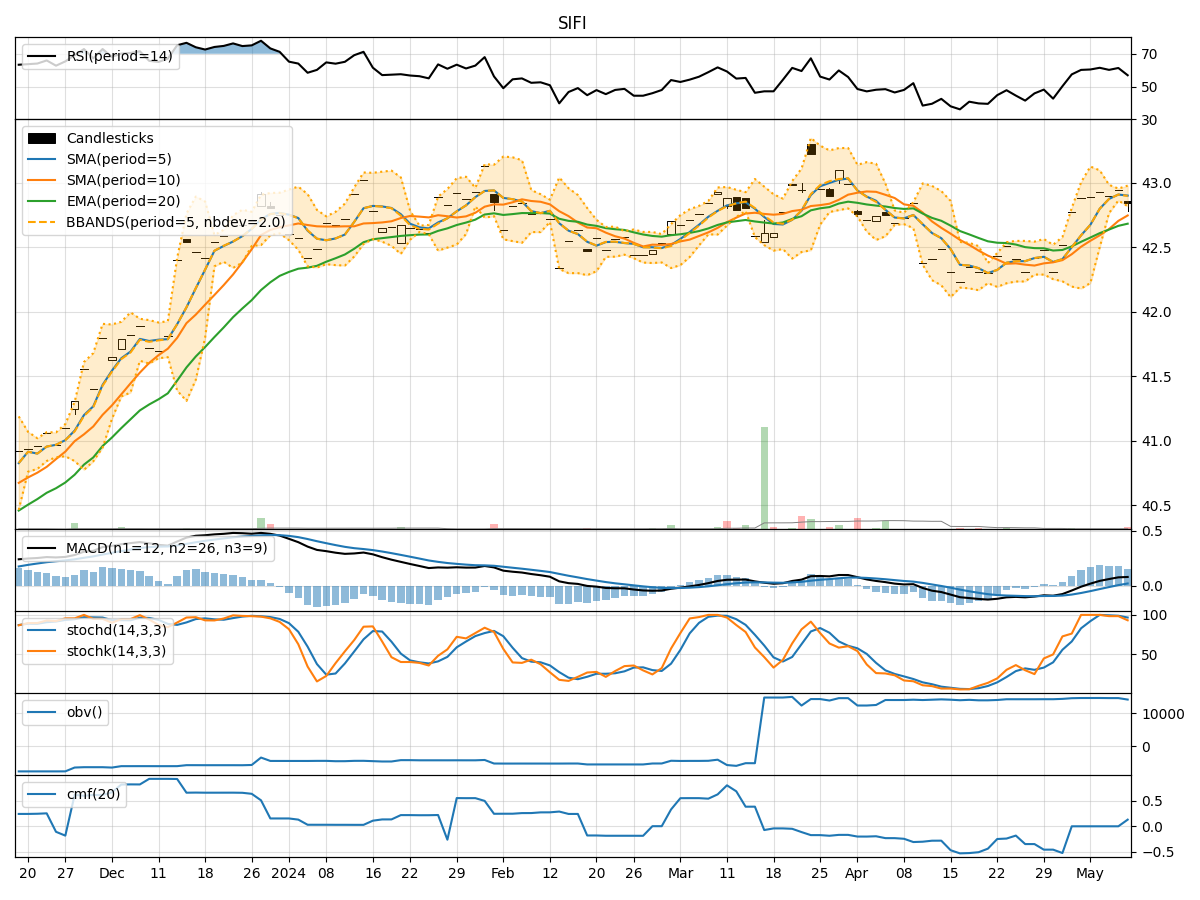
- Moving Averages (MA): The 5-day MA has been consistently above the closing prices, indicating a short-term uptrend.
- MACD: The MACD line has been above the signal line, suggesting bullish momentum.
- RSI: The RSI has been fluctuating around the 60-65 range, indicating a neutral to slightly bullish sentiment.
Momentum Indicators:
- Stochastic Oscillator: The Stochastic Oscillator has been in the overbought territory, signaling potential for a reversal.
- Williams %R: The Williams %R has been in the oversold region, indicating a possible buying opportunity.
Volatility Indicators:
- Bollinger Bands (BB): The stock price has been trading within the bands, suggesting a period of consolidation.
- Average True Range (ATR): The ATR has been relatively stable, indicating consistent price movement.
Volume Indicators:
- On-Balance Volume (OBV): The OBV has been fluctuating, showing mixed sentiment among investors.
- Chaikin Money Flow (CMF): The CMF has been neutral, indicating a balance between buying and selling pressure.
Key Observations:
- The trend indicators suggest a bullish bias in the short term.
- Momentum indicators show conflicting signals with overbought and oversold conditions.
- Volatility indicators point towards a period of consolidation.
- Volume indicators reflect mixed sentiment among market participants.
Conclusion:
Based on the analysis of the technical indicators, the stock price of SIFI is likely to experience a period of consolidation in the coming days. While the trend indicators indicate a bullish bias, conflicting signals from momentum indicators and the presence of consolidation patterns in volatility indicators suggest a lack of clear direction. Investors should exercise caution and closely monitor price movements for potential breakout or reversal signals before making trading decisions.