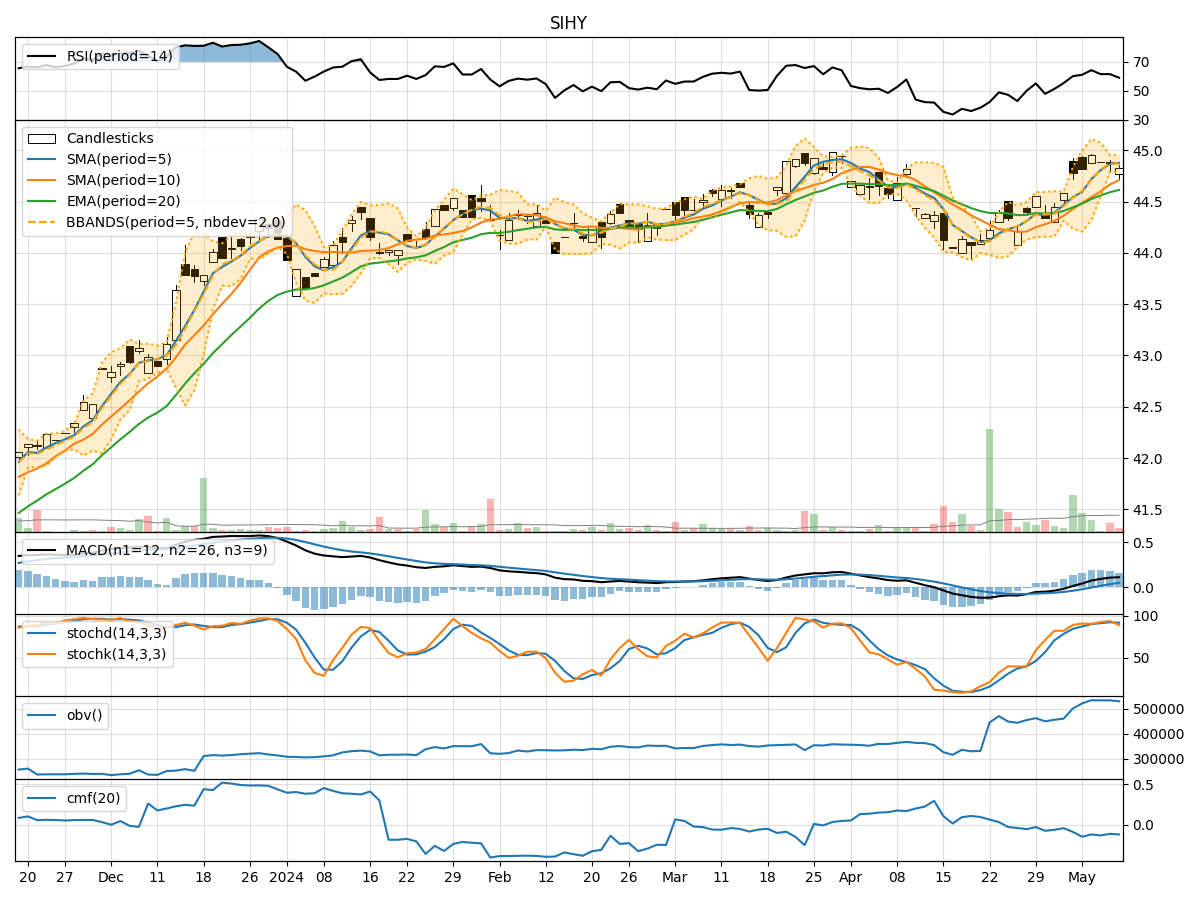
Technical Analysis of SIHY 2024-05-10
Overview:
In the last 5 trading days, the stock has shown a relatively stable performance with minor fluctuations in price and volume. The trend indicators suggest a slight uptrend, supported by the moving averages and MACD values. Momentum indicators indicate a neutral to slightly bullish sentiment, with RSI values hovering around the mid-range. Volatility indicators show a narrowing of the Bollinger Bands, indicating decreasing price volatility. Volume indicators suggest a lack of significant buying or selling pressure.
Trend Indicators:
- Moving Averages (MA): The 5-day MA has been consistently above the 10-day SMA, indicating a short-term bullish trend. The EMA(20) is also trending upwards, supporting a positive outlook.
- MACD: The MACD line has been above the signal line for the past few days, indicating bullish momentum. The MACD histogram is positive, suggesting increasing bullish momentum.
Momentum Indicators:
- RSI: The RSI values have been fluctuating around the neutral level of 50, indicating a balanced market sentiment without any extreme overbought or oversold conditions.
- Stochastic Oscillator: Both %K and %D values are in the overbought territory, suggesting a potential reversal or consolidation phase in the near future.
- Williams %R: The Williams %R is in the oversold region, indicating a possible buying opportunity.
Volatility Indicators:
- Bollinger Bands: The narrowing of the Bollinger Bands suggests decreasing price volatility and a potential period of consolidation or a breakout in the near future.
Volume Indicators:
- On-Balance Volume (OBV): The OBV has been relatively flat, indicating a lack of significant accumulation or distribution by market participants.
- Chaikin Money Flow (CMF): The CMF(20) is negative, suggesting that money flow has been predominantly negative over the past 20 days.
Conclusion:
Based on the analysis of the technical indicators, the stock is likely to experience sideways movement in the next few days. The trend indicators point towards a slight bullish bias, supported by the moving averages and MACD values. However, the momentum indicators suggest a neutral to slightly bearish sentiment, with potential signs of a reversal in the stochastic oscillator. The narrowing Bollinger Bands indicate a period of consolidation, while the volume indicators show a lack of significant buying or selling pressure. Overall, it is recommended to exercise caution and closely monitor the price action for any potential breakout or trend reversal.