Technical Analysis of SIMS 2024-05-10
Overview:
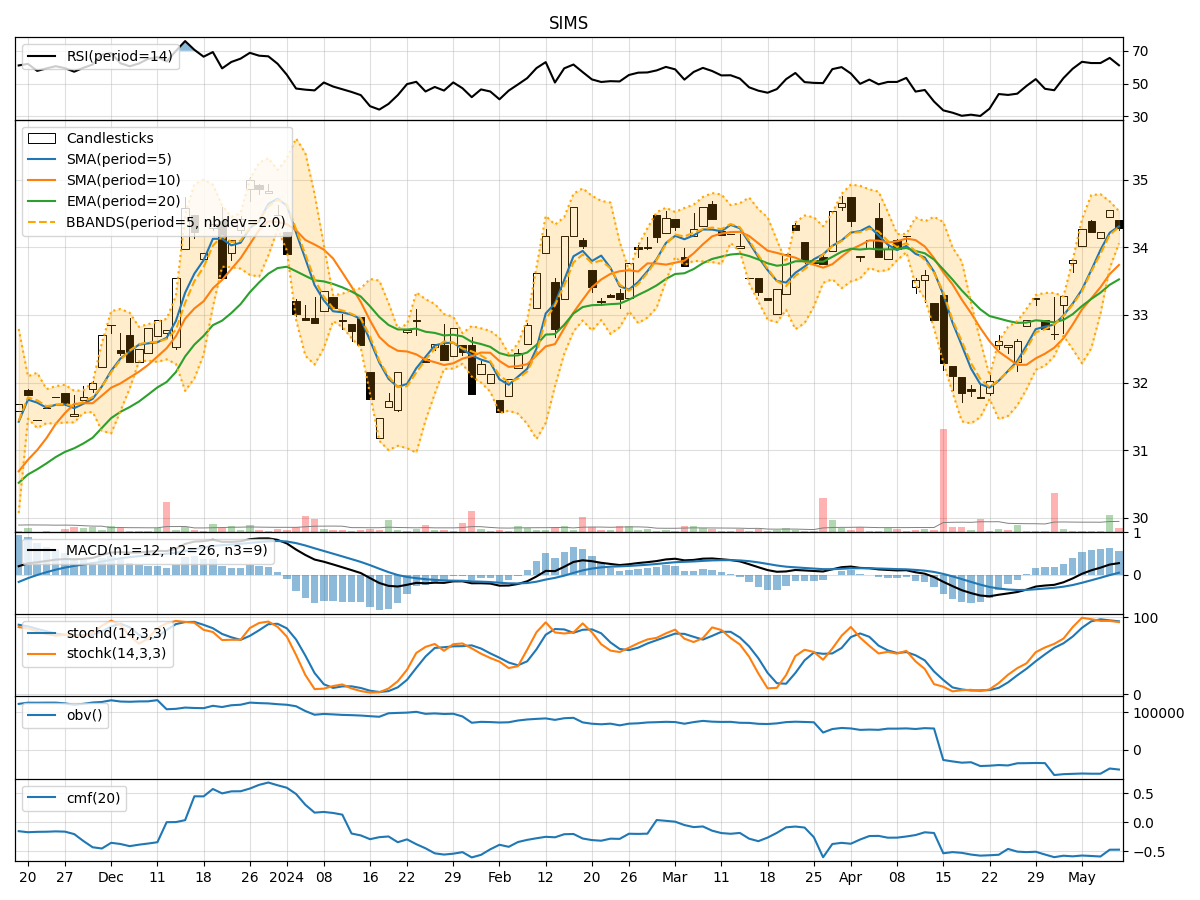
In analyzing the technical indicators for SIMS stock over the last 5 days, we will delve into the trends, momentum, volatility, and volume indicators to provide a comprehensive outlook on the possible future stock price movement. By examining key metrics such as moving averages, MACD, RSI, Bollinger Bands, and OBV, we aim to offer valuable insights and predictions for the upcoming trading days.
Trend Indicators:
- Moving Averages (MA): The 5-day moving average has been consistently above the longer-term SMAs, indicating a short-term bullish trend.
- MACD: The MACD line has been above the signal line, suggesting positive momentum in the stock price.
- EMA: The exponential moving average has been trending upwards, reflecting a bullish sentiment in the market.
Momentum Indicators:
- RSI: The RSI has been fluctuating around the overbought territory, indicating strong buying pressure.
- Stochastic Oscillator: Both %K and %D have been relatively high, signaling potential overbought conditions.
- Williams %R: The indicator has been hovering in the oversold region, suggesting a possible reversal in the stock price.
Volatility Indicators:
- Bollinger Bands: The stock price has been trading within the bands, indicating a period of consolidation.
- Bollinger Band Width: The narrowing of the bands suggests decreasing volatility and a potential breakout in the near future.
Volume Indicators:
- On-Balance Volume (OBV): The OBV has shown a slight decline, indicating some distribution in the stock.
- Chaikin Money Flow (CMF): The CMF has been negative, suggesting outflows from the stock.
Key Observations:
- The stock is currently in a bullish trend based on moving averages and MACD.
- Momentum indicators like RSI and Stochastic Oscillator suggest overbought conditions.
- Volatility is decreasing, as seen in the Bollinger Bands, indicating a potential period of consolidation.
- Volume indicators show mixed signals, with OBV declining but CMF remaining negative.
Conclusion:
Based on the analysis of technical indicators, the next few days for SIMS stock are likely to see consolidation with a potential for a bullish bias. Traders should be cautious of the overbought conditions indicated by momentum indicators and monitor for a breakout from the Bollinger Bands. The stock may experience some price fluctuations but is expected to maintain its overall upward trajectory in the short term.