Technical Analysis of SIO 2024-05-10
Overview:
In analyzing the technical indicators for SIO stock over the last 5 days, we will delve into the trend, momentum, volatility, and volume indicators to provide a comprehensive outlook on the possible future stock price movement. By examining these key indicators, we aim to offer valuable insights and predictions for the upcoming trading days.
Trend Indicators:
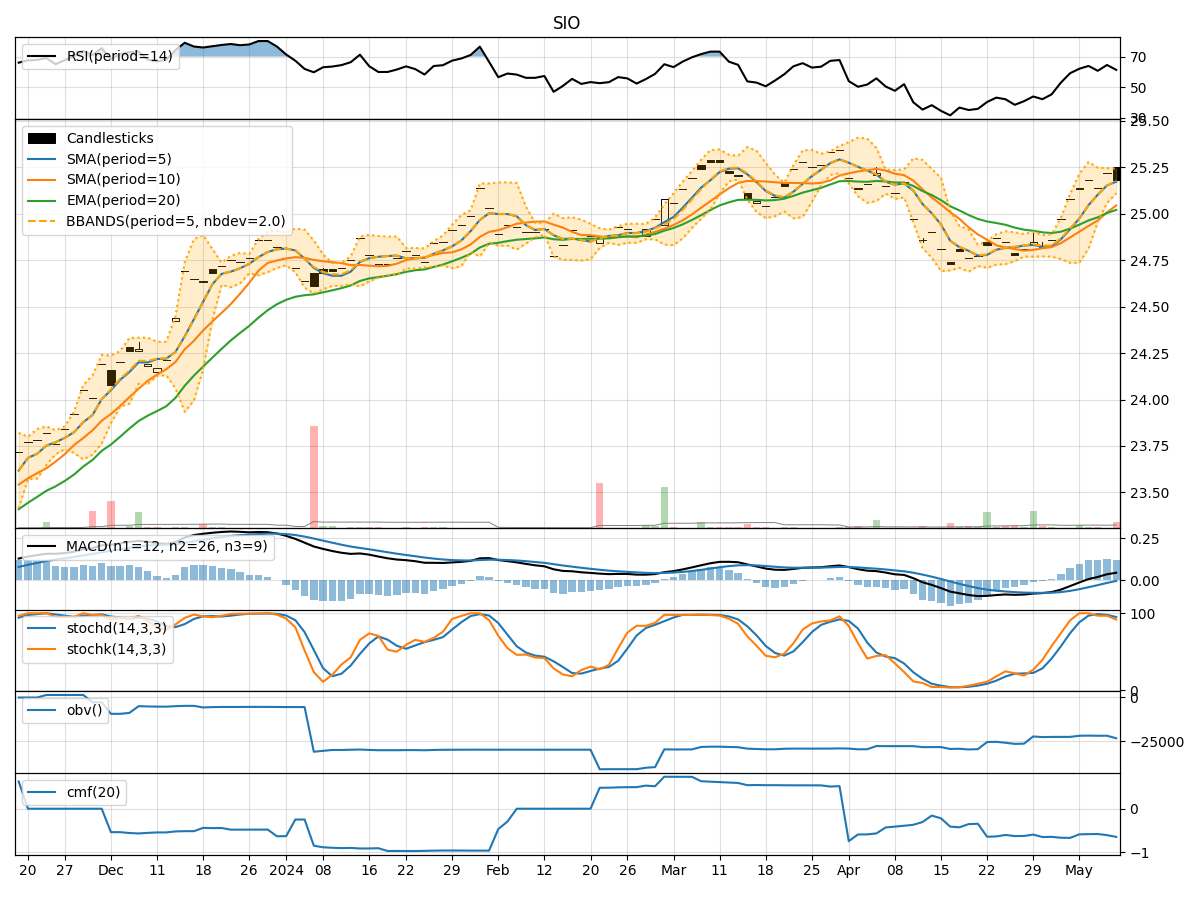
- Moving Averages (MA): The 5-day MA has been consistently above the closing price, indicating a short-term uptrend.
- MACD: The MACD line has been positive and increasing, suggesting bullish momentum.
- MACD Histogram: The histogram has been mostly positive, although showing a slight decrease in momentum.
Key Observation: The trend indicators point towards a bullish sentiment in the short term.
Momentum Indicators:
- RSI: The RSI has been fluctuating around the overbought territory, indicating strong buying pressure.
- Stochastic Oscillator: Both %K and %D have been relatively high, signaling potential overbought conditions.
- Williams %R: The indicator has been hovering in the oversold region, suggesting a potential reversal.
Key Observation: Momentum indicators reflect a mixed sentiment with signs of both overbought and oversold conditions.
Volatility Indicators:
- Bollinger Bands: The price has mostly stayed within the bands, indicating moderate volatility.
- Bollinger %B: The %B has been fluctuating around the midline, suggesting a balanced market sentiment.
Key Observation: Volatility indicators suggest a sideways movement with no clear trend.
Volume Indicators:
- On-Balance Volume (OBV): The OBV has been relatively stable, indicating consistent buying pressure.
- Chaikin Money Flow (CMF): The CMF has been negative, suggesting a slight outflow of money from the stock.
Key Observation: Volume indicators show a neutral sentiment with no significant buying or selling pressure.
Conclusion:
Based on the analysis of the technical indicators, the next few days for SIO stock are likely to see a bullish continuation in the short term, supported by the positive trend indicators. However, the mixed momentum signals and sideways movement indicated by volatility indicators may lead to some consolidation or minor corrections in the price. The volume indicators suggest a neutral stance, indicating a lack of strong conviction from market participants.
Overall, the stock is poised for a potential upward movement with some consolidation along the way. Traders should closely monitor momentum indicators for any signs of reversal or extended overbought conditions.