Technical Analysis of SIXO 2024-05-10
Overview:
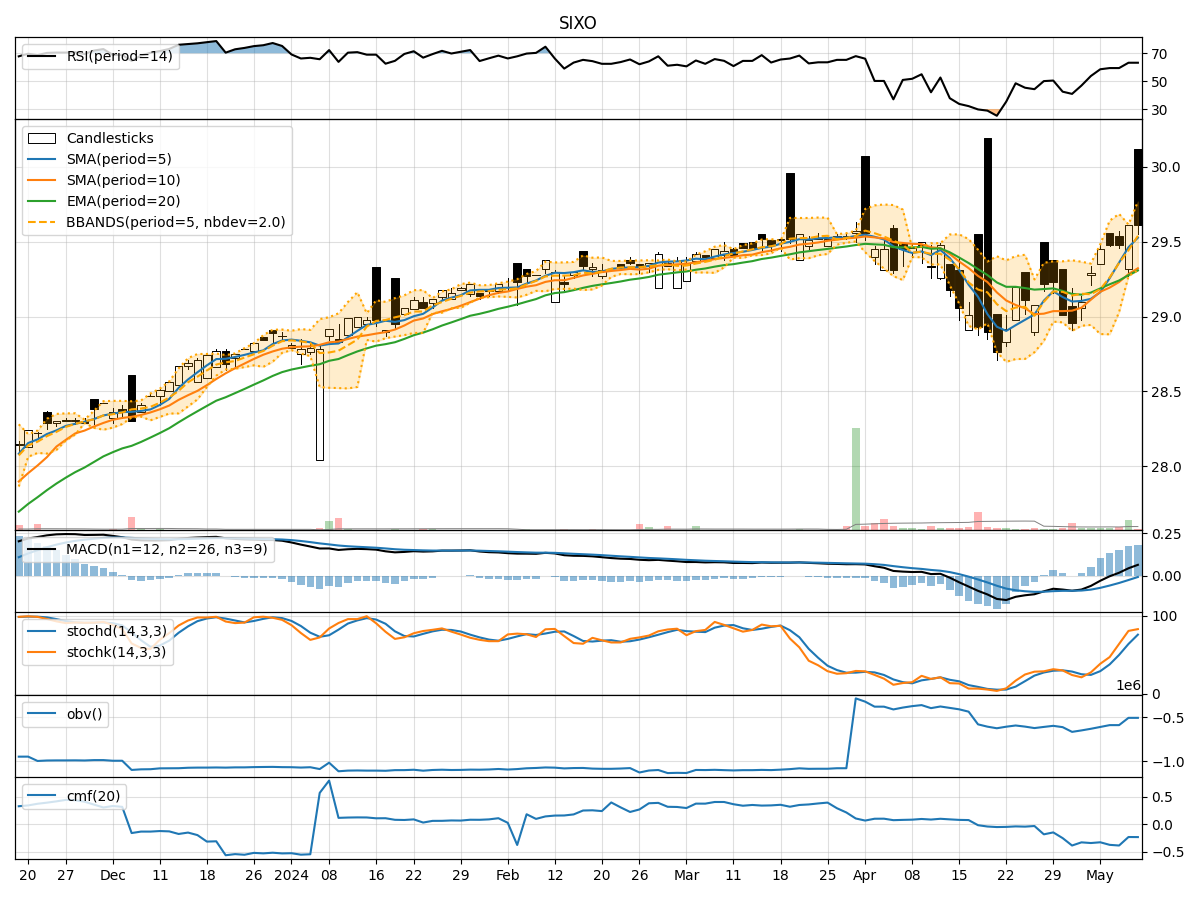
In analyzing the technical indicators for SIXO stock over the last 5 days, we will delve into the trend, momentum, volatility, and volume indicators to provide a comprehensive outlook on the possible stock price movement in the coming days.
Trend Analysis:
- Moving Averages (MA): The 5-day Moving Average (MA) has been consistently above the Simple Moving Average (SMA) and Exponential Moving Average (EMA), indicating a short-term bullish trend.
- MACD: The MACD line has been consistently above the signal line, with the MACD Histogram showing an increasing positive trend, suggesting bullish momentum.
Momentum Analysis:
- RSI: The Relative Strength Index (RSI) has been trending upwards, indicating increasing buying pressure.
- Stochastic Oscillator: Both %K and %D lines of the Stochastic Oscillator are in the overbought zone, suggesting a potential reversal or consolidation.
- Williams %R: The Williams %R is in the oversold territory, indicating a possible buying opportunity.
Volatility Analysis:
- Bollinger Bands (BB): The stock price has been trading within the upper Bollinger Band, indicating high volatility and a potential overbought condition.
- Bollinger Band Width: The Bollinger Band Width has been narrowing, suggesting a potential decrease in volatility.
Volume Analysis:
- On-Balance Volume (OBV): The OBV has been relatively flat, indicating a balance between buying and selling pressure.
- Chaikin Money Flow (CMF): The CMF has been negative, suggesting a net outflow of money from the stock.
Key Observations and Opinions:
- Trend: The trend indicators suggest a bullish sentiment in the short term.
- Momentum: The momentum indicators show conflicting signals, with the RSI indicating strength but the Stochastic Oscillator signaling potential overbought conditions.
- Volatility: The narrowing Bollinger Band Width indicates a potential decrease in volatility.
- Volume: The volume indicators suggest a lack of strong buying or selling pressure.
Conclusion:
Based on the analysis of the technical indicators, the next few days for SIXO stock could see further upside potential in the short term due to the bullish trend and momentum. However, caution is advised as the Stochastic Oscillator is in the overbought zone, indicating a possible reversal or consolidation. Traders should closely monitor price action and key support/resistance levels for potential entry or exit points.