Technical Analysis of SIXP 2024-05-10
Overview:
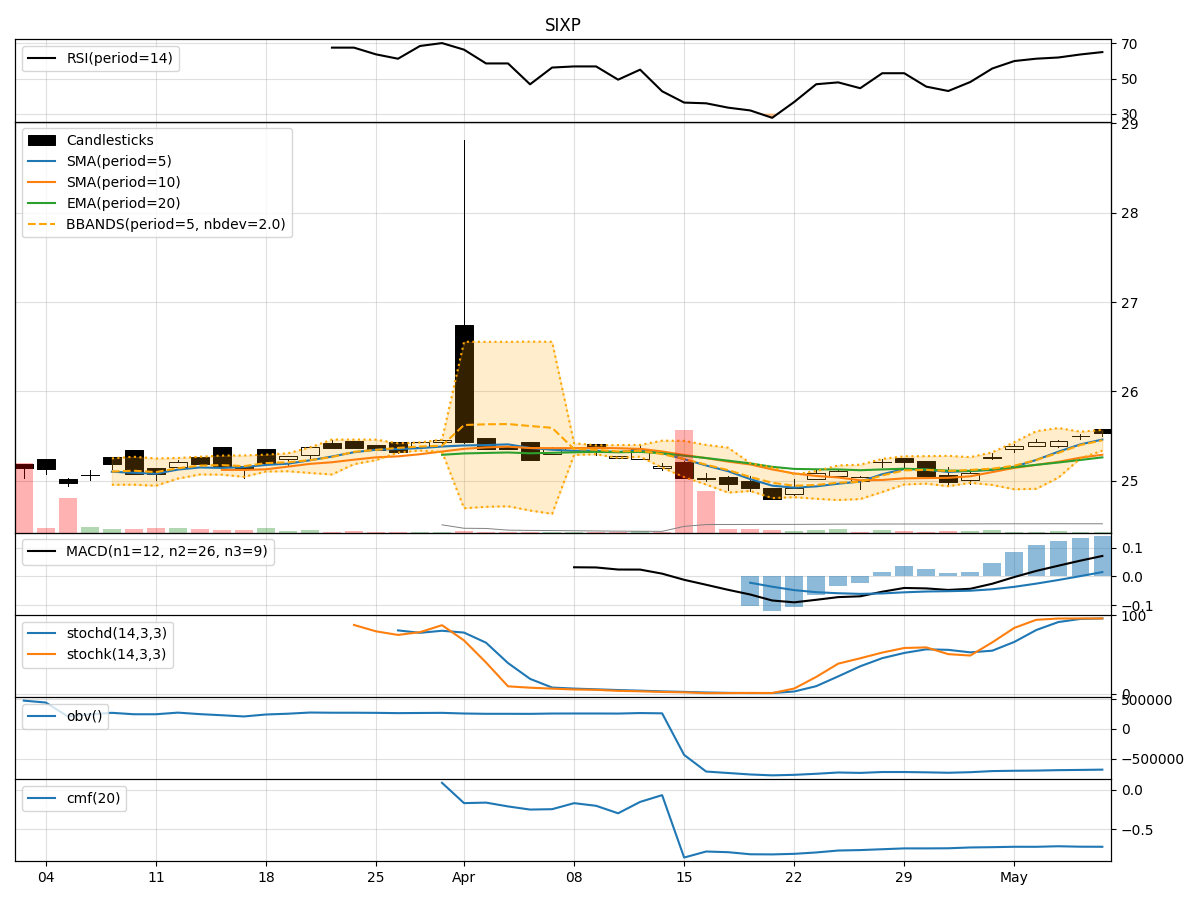
In the last 5 trading days, SIXP stock has shown a consistent uptrend in its price, supported by positive momentum and volatility indicators. The stock has been trading above its moving averages, with the MACD indicating a bullish trend. Momentum indicators like RSI and Stochastic oscillators suggest a strong buying momentum. Volatility has been relatively stable, indicating a consistent price movement. However, the volume has been decreasing, which could be a concern for the sustainability of the uptrend.
Trend Analysis:
- Moving Averages (MA): The stock price has been consistently above the 5-day moving average, indicating a short-term uptrend.
- MACD: The MACD line has been above the signal line, indicating a bullish trend.
- EMA: The exponential moving average has been trending upwards, supporting the bullish sentiment.
Key Observation: The trend indicators suggest a strong bullish sentiment in the stock price movement.
Momentum Analysis:
- RSI: The Relative Strength Index has been increasing, indicating increasing buying momentum.
- Stochastic Oscillators: Both %K and %D have been in the overbought zone, suggesting a strong buying momentum.
- Williams %R: The Williams %R is in the oversold zone, indicating a potential reversal.
Key Observation: Momentum indicators reflect a strong buying momentum in the stock.
Volatility Analysis:
- Bollinger Bands: The stock price has been trading within the upper Bollinger Band, indicating a potential overbought condition.
- Bollinger %B: The %B indicator has been above 0.8, suggesting a high volatility condition.
- Average True Range (ATR): The ATR has been relatively stable, indicating consistent price movement.
Key Observation: Volatility indicators suggest a high volatility in the stock price.
Volume Analysis:
- On-Balance Volume (OBV): The OBV has been decreasing, indicating a decrease in buying volume.
- Chaikin Money Flow (CMF): The CMF has been negative, suggesting a bearish money flow.
Key Observation: Volume indicators show a decreasing buying volume in the stock.
Conclusion:
Based on the analysis of trend, momentum, volatility, and volume indicators, the next few days' possible stock price movement for SIXP is likely to be sideways to slightly bearish. While the trend and momentum indicators suggest a bullish sentiment, the decreasing volume and potential overbought condition indicated by volatility indicators raise concerns about the sustainability of the uptrend. Traders should exercise caution and consider potential profit-taking opportunities in the short term.