Technical Analysis of SIXS 2024-05-10
Overview:
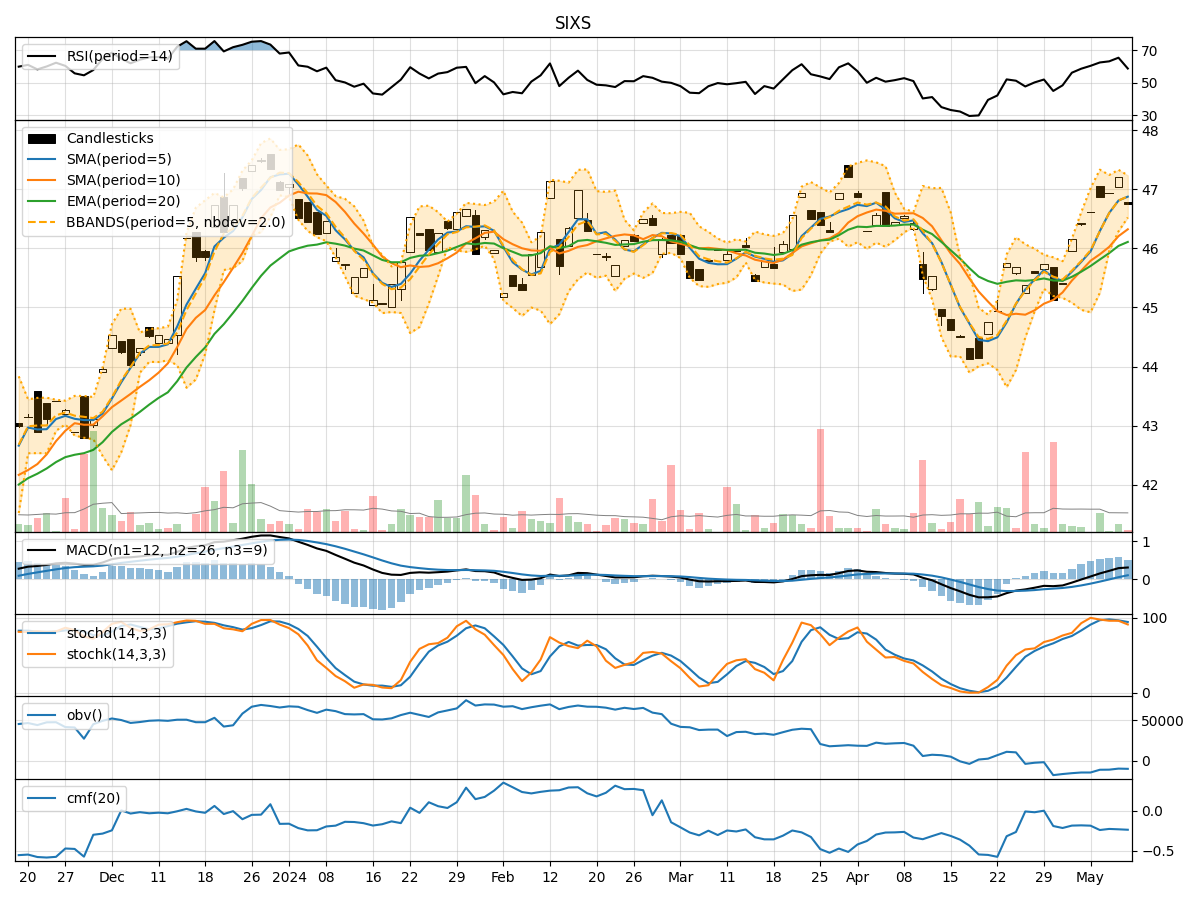
In the last 5 trading days, SIXS stock has shown a consistent uptrend in its closing price, with increasing volumes. The moving averages (MA) have been trending upwards, indicating a positive momentum. The Relative Strength Index (RSI) and Stochastic indicators suggest a bullish sentiment, while the Bollinger Bands show an expanding volatility. On the volume side, the On-Balance Volume (OBV) has been slightly negative, indicating some distribution.
Trend Indicators Analysis:
- Moving Averages (MA): The 5-day MA has been consistently above the 10-day Simple Moving Average (SMA), indicating a short-term bullish trend.
- MACD: The MACD line has been above the signal line, with both lines trending upwards, suggesting a continuation of the bullish momentum.
- Momentum: The RSI is in the overbought territory, indicating a strong buying pressure. The Stochastic indicators also show bullish signals.
Momentum Indicators Analysis:
- RSI: The RSI is above 70, indicating an overbought condition. This could potentially lead to a short-term pullback or consolidation.
- Stochastic: Both %K and %D lines are in the overbought zone, suggesting a potential reversal or correction in the stock price.
Volatility Indicators Analysis:
- Bollinger Bands: The widening of the Bollinger Bands suggests increasing volatility in the stock price. This could lead to larger price swings in the near future.
Volume Indicators Analysis:
- OBV: The slightly negative OBV indicates some distribution happening in the stock, which could potentially lead to a minor price correction.
Key Observations:
- The stock is currently in a strong uptrend based on the moving averages and MACD.
- Momentum indicators like RSI and Stochastic are signaling overbought conditions, which might lead to a short-term correction.
- Volatility is expanding, indicating potential larger price movements.
- The OBV shows some distribution, which could impact the stock price in the short term.
Conclusion:
Based on the technical indicators and analysis: - Short-Term: The stock might experience a short-term correction or consolidation due to the overbought conditions indicated by RSI and Stochastic. - Medium-Long Term: The overall trend remains bullish, supported by the moving averages and MACD. Therefore, any pullback could present a buying opportunity for investors looking to enter or add to their positions. - Volatility: Expect larger price swings in the coming days due to the expanding Bollinger Bands. - Volume: Monitor the OBV closely for any significant changes in accumulation or distribution patterns.
Recommendation:
- Short-Term Traders: Consider taking profits or setting tight stop-loss orders to protect gains during a potential correction.
- Long-Term Investors: Use any pullbacks as opportunities to accumulate more shares in line with the overall bullish trend.
- Risk Management: Stay vigilant on the increasing volatility and adjust position sizes accordingly to manage risk effectively.
Overall View:
- Short-Term: Bearish (due to overbought conditions)
- Medium-Long Term: Bullish (based on moving averages and MACD)
- Volatility: Increasing
- Volume: Slightly Bearish (due to negative OBV)
Always remember to conduct your own research and consider other fundamental factors before making any investment decisions.