Technical Analysis of SJNK 2024-05-10
Overview:
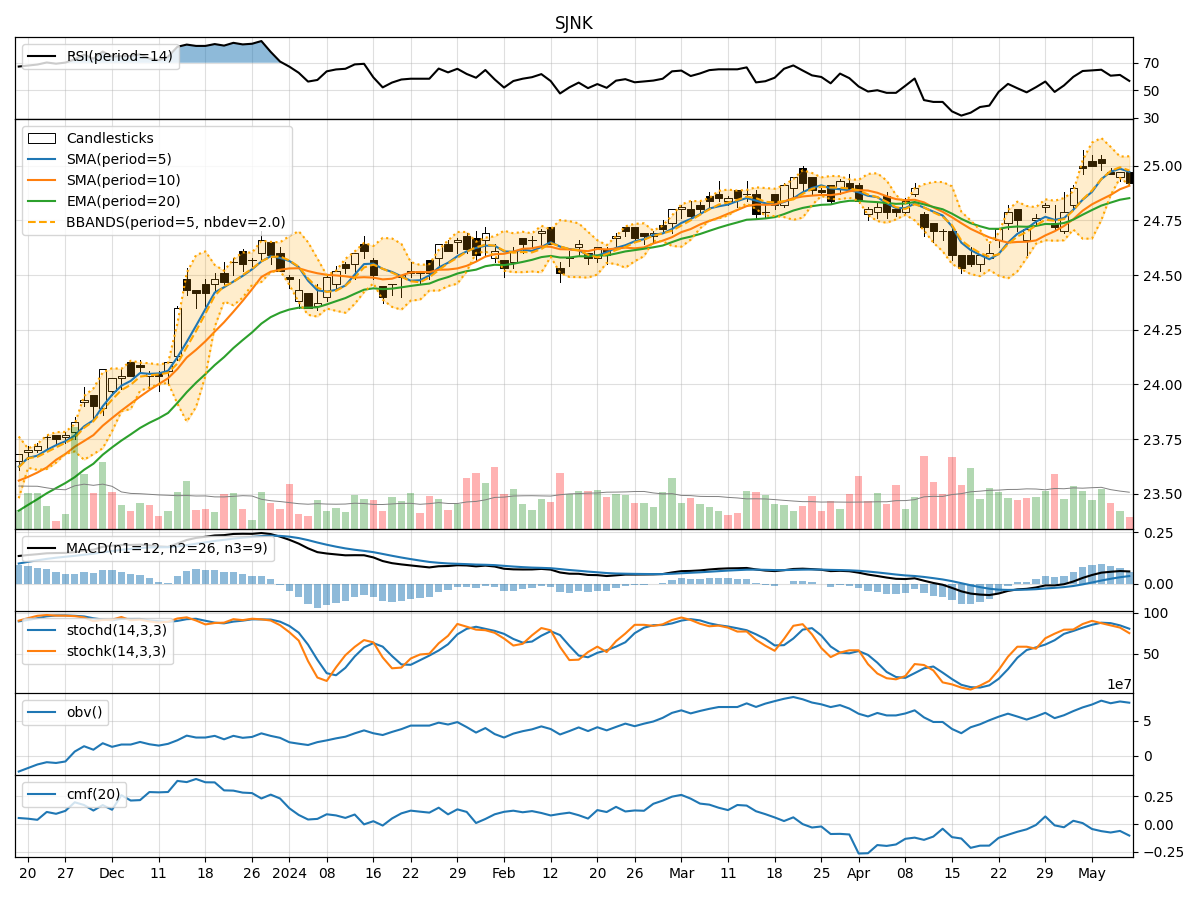
In analyzing the technical indicators for SJNK over the last 5 days, we will delve into the trend, momentum, volatility, and volume indicators to provide a comprehensive outlook on the possible stock price movement in the coming days.
Trend Analysis:
- Moving Averages (MA): The 5-day MA has been consistently above the closing prices, indicating a short-term uptrend.
- MACD: The MACD line has been above the signal line, suggesting a bullish momentum.
- EMA: The EMA has been trending upwards, supporting the bullish sentiment.
Key Observation: The trend indicators point towards an upward movement in the stock price.
Momentum Analysis:
- RSI: The RSI has been fluctuating around the 50 level, indicating a neutral momentum.
- Stochastic Oscillator: Both %K and %D have been declining, signaling a potential reversal in momentum.
- Williams %R: The indicator has been in oversold territory, suggesting a possible bounce back.
Key Observation: The momentum indicators are mixed, with a slight bias towards a reversal in momentum.
Volatility Analysis:
- Bollinger Bands: The stock price has been trading within the bands, indicating a period of consolidation.
- Bollinger %B: The %B indicator has been hovering around the midline, reflecting a balanced volatility.
- Average True Range (ATR): The ATR has been relatively stable, suggesting consistent price movements.
Key Observation: The volatility indicators suggest a sideways movement in the stock price.
Volume Analysis:
- On-Balance Volume (OBV): The OBV has been fluctuating, showing no clear trend in volume.
- Chaikin Money Flow (CMF): The CMF has been negative, indicating selling pressure in the stock.
Key Observation: The volume indicators reflect uncertainty in the stock's trading volume.
Conclusion:
Based on the analysis of the technical indicators, the next few days' possible stock price movement for SJNK is likely to be sideways with a slight upward bias. The trend indicators suggest an upward trajectory, while the momentum indicators hint at a potential reversal in momentum. Volatility indicators point towards a period of consolidation, and volume indicators indicate uncertainty in trading volume.
Overall, the stock is expected to consolidate in the near term with a potential for a modest upward movement. Traders should closely monitor key support and resistance levels for potential entry and exit points.