Technical Analysis of SLVO 2024-05-10
Overview:
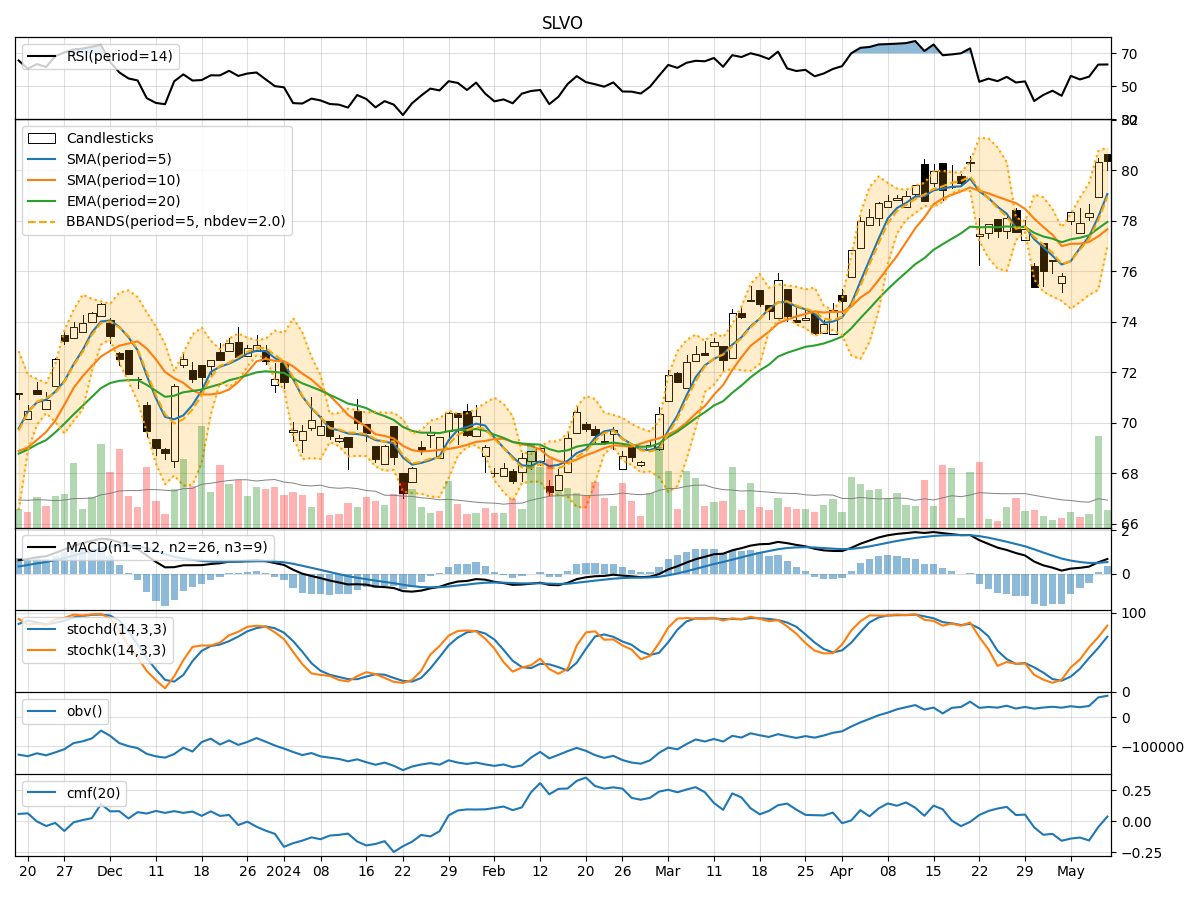
In analyzing the technical indicators for SLVO over the last 5 days, we will delve into the trend, momentum, volatility, and volume indicators to provide a comprehensive outlook on the possible stock price movement in the coming days.
Trend Analysis:
- Moving Averages (MA): The 5-day Moving Average (MA) has been consistently rising, indicating a bullish trend in the short term.
- MACD: The MACD line has been above the signal line, suggesting a bullish momentum.
- EMA: The Exponential Moving Average (EMA) has also been trending upwards, supporting the bullish sentiment.
Momentum Analysis:
- RSI: The Relative Strength Index (RSI) has been increasing, indicating strengthening buying momentum.
- Stochastic Oscillator: Both %K and %D have been in the overbought zone, signaling a potential reversal or consolidation.
- Williams %R: The Williams %R is in the oversold territory, suggesting a possible buying opportunity.
Volatility Analysis:
- Bollinger Bands: The stock price has been trading near the upper Bollinger Band, indicating high volatility and a potential overbought condition.
- Bollinger Band Width: The Band Width has been expanding, suggesting increased price volatility.
Volume Analysis:
- On-Balance Volume (OBV): The OBV has been increasing, indicating accumulation by investors.
- Chaikin Money Flow (CMF): The CMF has been negative, suggesting selling pressure in the market.
Key Observations and Opinions:
- Trend: The trend indicators suggest a bullish sentiment in the short term.
- Momentum: While the RSI indicates buying momentum, the Stochastic Oscillator and Williams %R suggest a potential reversal or consolidation.
- Volatility: High volatility near the upper Bollinger Band may lead to a price correction.
- Volume: The OBV shows accumulation, but the CMF signals selling pressure.
Conclusion:
Based on the analysis of the technical indicators, the next few days' possible stock price movement for SLVO is likely to be sideways to slightly bearish. The stock may experience a period of consolidation or a minor pullback due to the overbought conditions indicated by the Stochastic Oscillator and the high volatility near the upper Bollinger Band. Investors should closely monitor key support levels and be cautious of a potential reversal in the short term.