Technical Analysis of SLYG 2024-05-10
Overview:
In analyzing the technical indicators for SLYG over the last 5 days, we will delve into the trend, momentum, volatility, and volume indicators to provide a comprehensive outlook on the possible stock price movement in the coming days.
Trend Analysis:
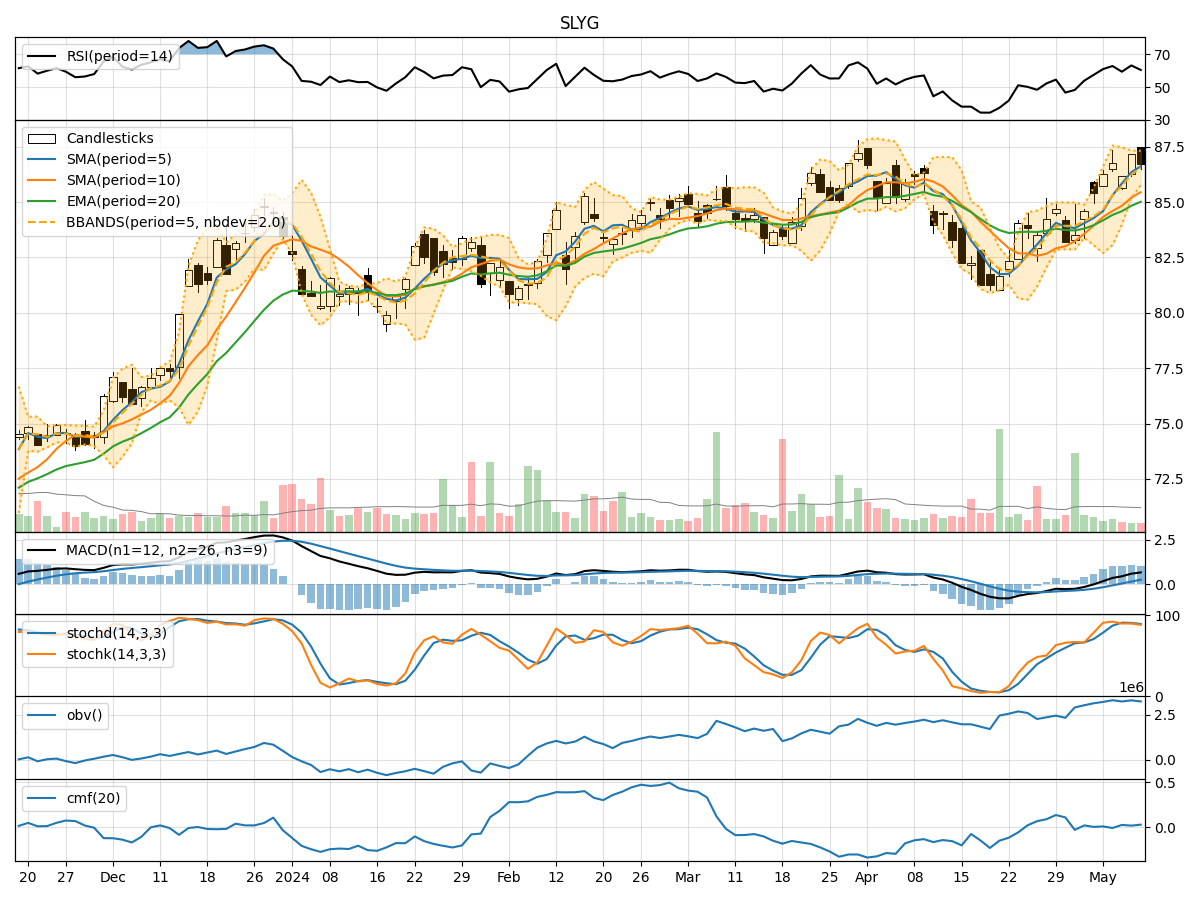
- Moving Averages (MA): The 5-day Moving Average has been consistently above the Simple Moving Average (SMA) and Exponential Moving Average (EMA), indicating a bullish trend.
- MACD: The MACD line has been above the signal line, with the MACD Histogram showing positive values, suggesting bullish momentum.
Momentum Analysis:
- RSI: The Relative Strength Index (RSI) has been fluctuating around the 60-65 range, indicating a neutral momentum.
- Stochastic Oscillator: Both %K and %D have been in the overbought zone, suggesting a potential reversal or consolidation.
Volatility Analysis:
- Bollinger Bands (BB): The stock price has been trading within the Bollinger Bands, with the bands narrowing, indicating decreasing volatility.
- Bollinger %B: The %B indicator has been hovering around 0.5, suggesting a neutral stance.
Volume Analysis:
- On-Balance Volume (OBV): The OBV has shown slight fluctuations but overall has been relatively stable, indicating consistent buying interest.
- Chaikin Money Flow (CMF): The CMF has been positive, reflecting buying pressure in the stock.
Key Observations:
- The trend indicators suggest a bullish sentiment in the short term.
- Momentum indicators show a neutral stance with a potential for a reversal.
- Volatility indicators point towards decreasing volatility in the stock.
- Volume indicators indicate consistent buying interest in the stock.
Conclusion:
Based on the analysis of the technical indicators, the stock price of SLYG is likely to experience further upward movement in the coming days. The bullish trend supported by the MACD and moving averages, coupled with consistent buying interest indicated by volume indicators, suggests a positive outlook. However, caution is advised as the stochastic oscillator signals potential overbought conditions, and a reversal or consolidation phase could be on the horizon. Overall, the stock is primed for a bullish continuation in the short term.