Technical Analysis of SLYV 2024-05-10
Overview:
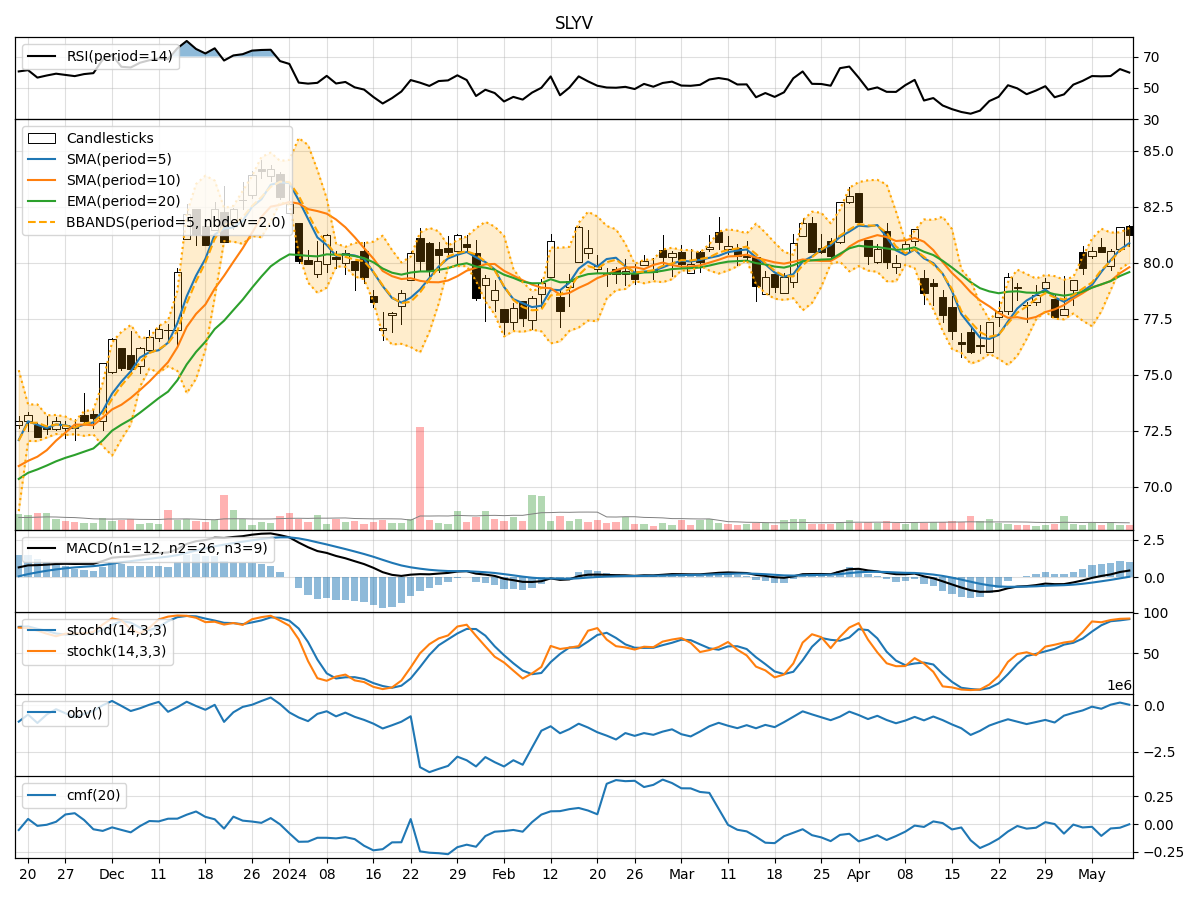
In analyzing the technical indicators for SLYV over the last 5 days, we will delve into the trend, momentum, volatility, and volume indicators to provide a comprehensive outlook on the possible stock price movement. By examining these key factors, we aim to offer valuable insights and predictions for the upcoming days.
Trend Analysis:
- Moving Averages (MA): The 5-day Moving Average (MA) has been consistently trending upwards, indicating a positive momentum in the stock price.
- MACD: The Moving Average Convergence Divergence (MACD) has shown a series of increasing values, suggesting a strengthening bullish trend.
- RSI: The Relative Strength Index (RSI) has been fluctuating but generally staying within the neutral to slightly overbought territory.
Momentum Analysis:
- Stochastic Oscillator: Both %K and %D values of the Stochastic Oscillator have been in the overbought zone, signaling a potential reversal or consolidation.
- Williams %R: The Williams %R indicator has been hovering around oversold levels, indicating a possible buying opportunity.
Volatility Analysis:
- Bollinger Bands: The Bollinger Bands have shown a narrowing of the bands, suggesting a decrease in volatility and a potential period of consolidation.
- BB% (Bollinger Band %B): The BB% has been relatively stable, indicating a balanced market sentiment.
Volume Analysis:
- On-Balance Volume (OBV): The OBV has shown a slight decrease, suggesting some distribution of shares.
- Chaikin Money Flow (CMF): The CMF has been negative, indicating a bearish money flow in the stock.
Conclusion:
Based on the analysis of the technical indicators, the next few days' possible stock price movement for SLYV could see sideways consolidation with a slight bias towards a bearish outlook. The overbought signals from the Stochastic Oscillator and the potential reversal indicated by the Williams %R suggest a temporary pullback or consolidation phase. The narrowing Bollinger Bands and negative CMF further support the view of a sideways movement. Traders may consider adopting a cautious approach and closely monitor key support and resistance levels for potential entry or exit points.
In summary, the overall technical outlook for SLYV leans towards a consolidation phase with a slight bearish bias in the near term. It is essential for investors to remain vigilant and adapt their strategies accordingly to navigate potential market fluctuations.