Technical Analysis of SMAY 2024-05-10
Overview:
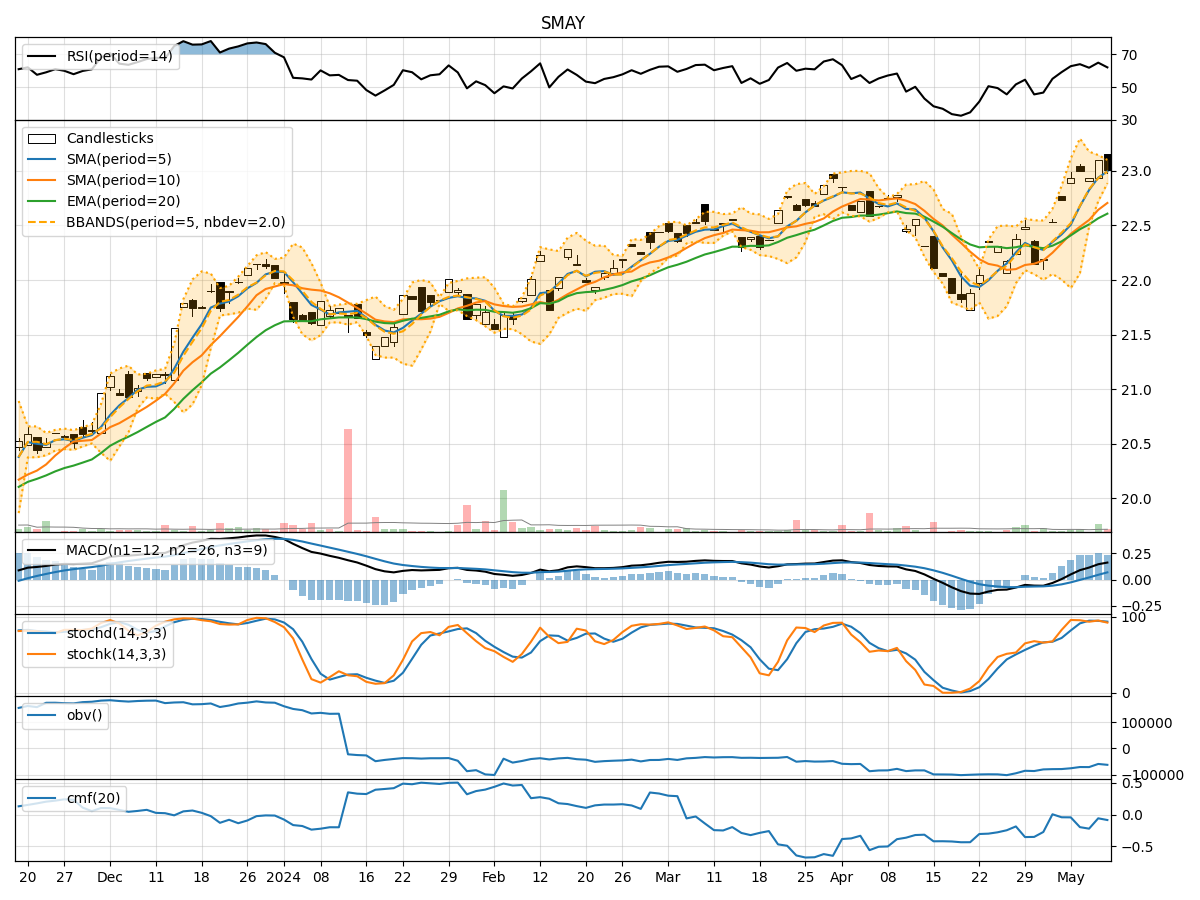
In analyzing the provided SMAY TA data for the last 5 days, we will delve into the technical indicators across trend, momentum, volatility, and volume to derive insights into the possible future stock price movement. By examining these indicators, we aim to provide a comprehensive and informed perspective on the stock's potential trajectory.
Trend Indicators:
- Moving Averages (MA): The 5-day Moving Average (MA) has been consistently above the closing prices, indicating an upward trend. This suggests positive momentum in the stock's price movement.
- MACD: The Moving Average Convergence Divergence (MACD) has shown an increasing trend, with the MACD line consistently above the signal line. This signals bullish momentum in the stock.
- EMA: The Exponential Moving Average (EMA) has been trending upwards, further supporting the bullish outlook.
Momentum Indicators:
- RSI: The Relative Strength Index (RSI) has been hovering around 60-65, indicating neutral momentum in the stock.
- Stochastic Oscillator: Both %K and %D have been gradually decreasing, suggesting a weakening momentum.
- Williams %R: The Williams %R is in the oversold territory, indicating a potential reversal in the stock's price movement.
Volatility Indicators:
- Bollinger Bands: The Bollinger Bands have been narrowing, indicating decreasing volatility and a possible consolidation phase in the stock.
- Bollinger %B: The %B indicator is below 1, suggesting that the stock is trading below the lower Bollinger Band, potentially indicating an oversold condition.
Volume Indicators:
- On-Balance Volume (OBV): The OBV has been fluctuating, indicating mixed sentiment among investors.
- Chaikin Money Flow (CMF): The CMF has been negative, suggesting outflow of money from the stock.
Key Observations and Opinions:
- The trend indicators point towards a bullish bias, supported by the moving averages and MACD.
- Momentum indicators show a mixed picture, with RSI neutral, Stochastic Oscillator weakening, and Williams %R in oversold territory.
- Volatility indicators suggest a potential consolidation phase with decreasing volatility.
- Volume indicators reflect mixed sentiment among investors, with OBV fluctuating and CMF negative.
Conclusion:
Based on the analysis of the technical indicators, the stock is likely to experience short-term consolidation before potentially resuming its upward trajectory. Investors should monitor the momentum indicators closely for any signs of a reversal in the stock's price movement. Overall, the outlook remains bullish with a potential for a resumption of the uptrend in the coming days.