Technical Analysis of SMCO 2024-05-10
Overview:
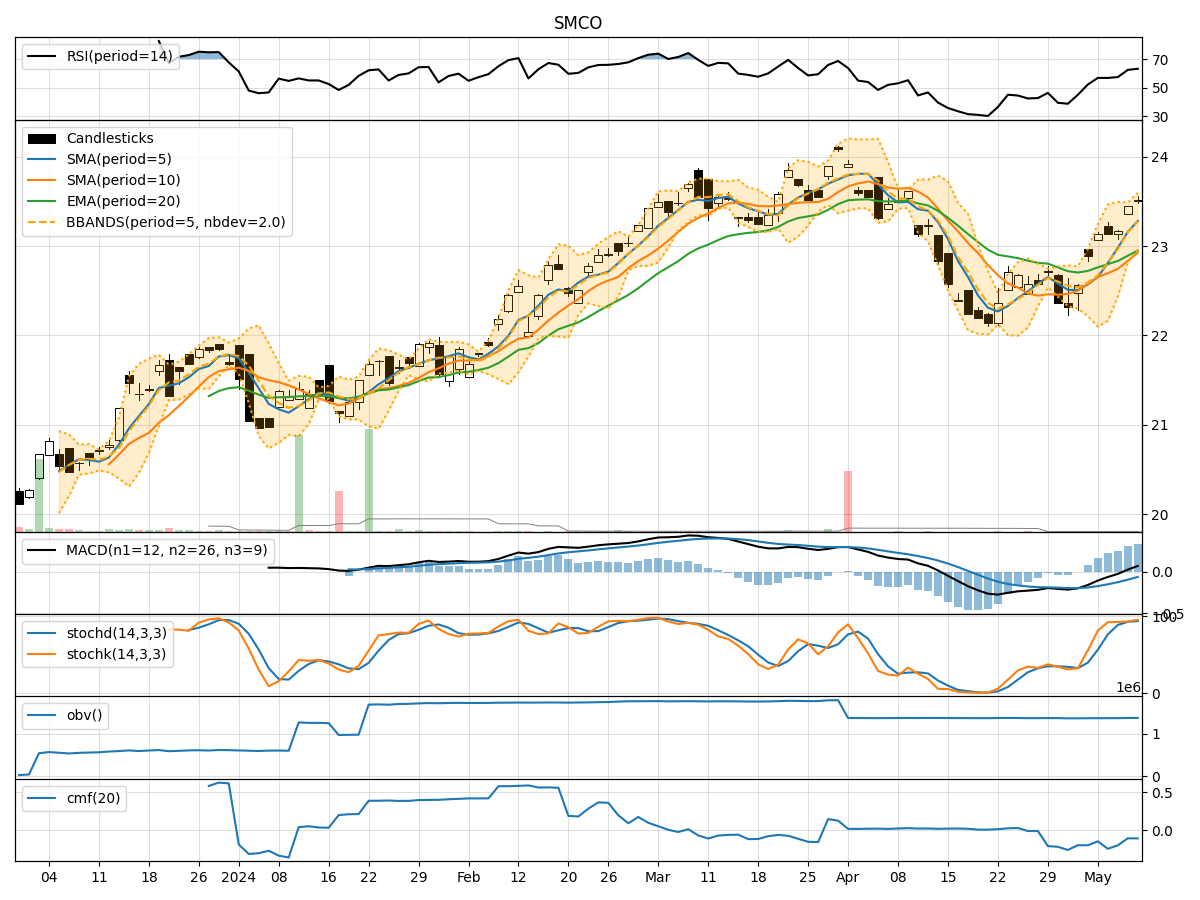
In the last 5 trading days, SMCO has shown a consistent uptrend in its stock price, with increasing volumes. The moving averages have been trending upwards, and momentum indicators like RSI and Stochastic oscillators are showing overbought conditions. Volatility indicators like Bollinger Bands are narrowing, indicating a potential breakout. Volume indicators are slightly negative, suggesting some distribution.
Trend Analysis:
- Moving Averages (MA): The 5-day MA has been consistently above the 10-day SMA, indicating a short-term bullish trend. The EMA(20) is also trending upwards, supporting the bullish sentiment.
- MACD: The MACD line has been consistently above the signal line, indicating a bullish trend. The MACD histogram is also showing positive values, suggesting upward momentum.
Momentum Analysis:
- RSI: The RSI has been in the overbought territory, indicating a potential reversal or consolidation in the stock price.
- Stochastic Oscillators: Both %K and %D are in the overbought zone, suggesting a possible pullback or consolidation.
Volatility Analysis:
- Bollinger Bands (BB): The Bollinger Bands are narrowing, indicating decreasing volatility and a potential breakout in the stock price.
- Bollinger %B (BBP): The %B is below 1, suggesting the stock price is trading below the upper Bollinger Band, indicating a potential reversal or consolidation.
Volume Analysis:
- On-Balance Volume (OBV): The OBV has been slightly negative, indicating some distribution happening in the stock.
- Chaikin Money Flow (CMF): The CMF is negative, suggesting selling pressure in the stock.
Conclusion:
Based on the technical indicators and analysis: - Trend: The stock is in a strong upward trend. - Momentum: The momentum indicators are signaling overbought conditions, indicating a potential reversal or consolidation. - Volatility: The narrowing Bollinger Bands suggest a potential breakout, but the %B below 1 indicates a possible reversal or consolidation. - Volume: The slightly negative OBV and CMF suggest some distribution in the stock.
Overall View:
Given the overbought conditions in momentum indicators, narrowing Bollinger Bands, and negative volume indicators, the stock is likely to experience a short-term consolidation or pullback in the next few days. Traders should be cautious and consider taking profits or waiting for a better entry point.