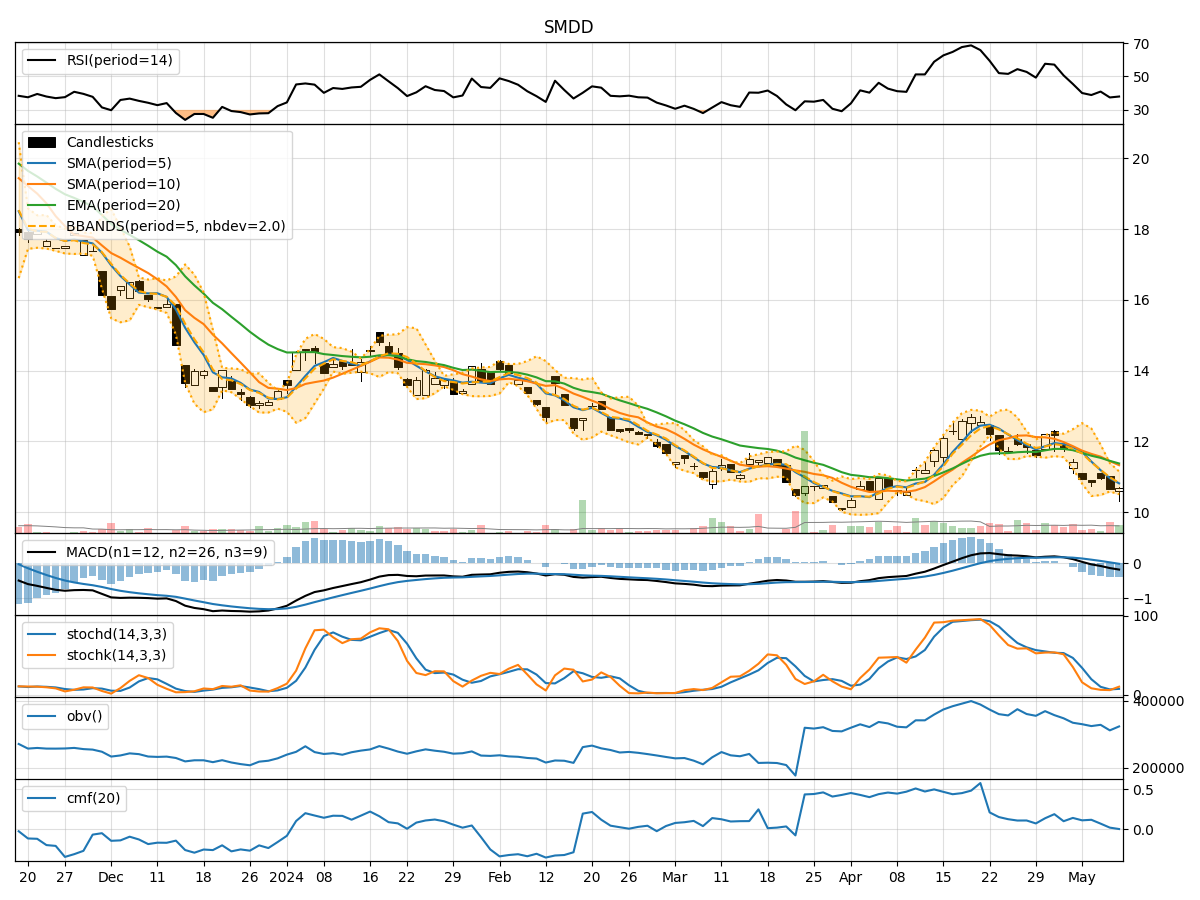
Technical Analysis of SMDD 2024-05-10
Overview:
In the last 5 trading days, SMDD stock has shown a downward trend in its closing price. Various technical indicators across trend, momentum, volatility, and volume categories provide insights into the stock's potential future movements. Let's analyze each category in detail to determine the possible next few days' stock price movement.
Trend Analysis:
- Moving Averages (MA): The 5-day Moving Average (MA) has been consistently below the Simple Moving Average (SMA) and Exponential Moving Average (EMA), indicating a bearish trend.
- MACD: The MACD line has been below the signal line, with negative values, suggesting a bearish momentum.
- Conclusion: The trend indicators point towards a downward movement in the stock price.
Momentum Analysis:
- RSI: The Relative Strength Index (RSI) has been below 50, indicating a bearish momentum.
- Stochastic Oscillator: Both %K and %D have been in the oversold territory, suggesting a potential reversal.
- Conclusion: The momentum indicators signal a bearish sentiment in the short term.
Volatility Analysis:
- Bollinger Bands (BB): The stock price has been trading below the lower Bollinger Band, indicating oversold conditions.
- Conclusion: Volatility indicators suggest a potential reversal or a period of consolidation.
Volume Analysis:
- On-Balance Volume (OBV): The OBV has been fluctuating, indicating indecision among investors.
- Chaikin Money Flow (CMF): The CMF has been positive but decreasing, suggesting weakening buying pressure.
- Conclusion: Volume indicators reflect mixed signals with a slight bearish bias.
Conclusion:
Based on the comprehensive analysis of technical indicators, the next few days' possible stock price movement for SMDD is likely to be downward in the short term. The trend indicators, momentum indicators, and volume indicators all point towards a bearish sentiment. However, the volatility indicators hint at a potential reversal or consolidation phase. Traders and investors should exercise caution and consider risk management strategies in this market environment.
Key Takeaways:
- Trend: Downward
- Momentum: Bearish
- Volatility: Potential reversal or consolidation
- Volume: Mixed signals with a bearish bias
It is crucial to monitor the stock closely for any signs of a trend reversal or confirmation of the current bearish sentiment. Additionally, incorporating fundamental analysis alongside technical analysis can provide a more holistic view of the stock's future prospects.