Technical Analysis of SMDV 2024-05-10
Overview:
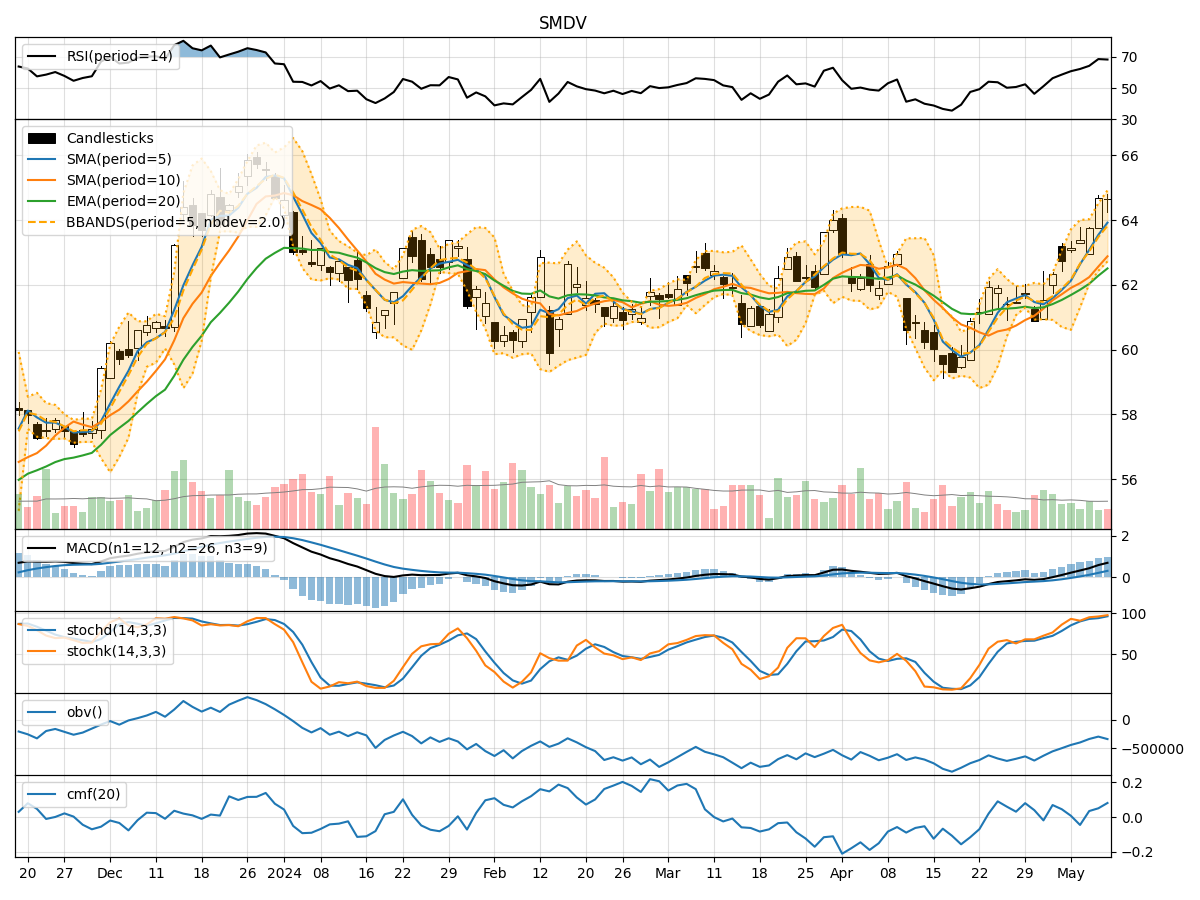
In analyzing the technical indicators for SMDV over the last 5 days, we will delve into the trend, momentum, volatility, and volume indicators to provide a comprehensive outlook on the possible stock price movement in the coming days. By examining these key aspects, we aim to offer valuable insights and predictions for informed decision-making.
Trend Indicators:
- Moving Averages (MA): The 5-day MA has been consistently above the 10-day SMA, indicating a short-term bullish trend. The EMA(20) has been steadily increasing, reflecting positive momentum.
- MACD: The MACD line has been above the signal line, with both lines showing an upward trend. The MACD histogram has been consistently positive, suggesting bullish momentum.
Momentum Indicators:
- RSI: The RSI has been trending upwards and is currently in the overbought territory, indicating a strong bullish momentum.
- Stochastic Oscillator: Both %K and %D lines have been in the overbought zone, signaling a strong bullish momentum.
- Williams %R: The indicator has been consistently in the oversold region, suggesting a strong bullish sentiment.
Volatility Indicators:
- Bollinger Bands (BB): The stock price has been trading within the upper Bollinger Band, indicating an uptrend with increased volatility.
- Bollinger Band Width (BBW): The BBW has been expanding, suggesting a potential increase in volatility.
- Bollinger Band %B (BBP): The %B has been above 0.5, indicating an upward trend.
Volume Indicators:
- On-Balance Volume (OBV): The OBV has been increasing, reflecting positive buying pressure.
- Chaikin Money Flow (CMF): The CMF has been positive, indicating strong buying pressure over the past 20 days.
Key Observations and Opinions:
- Trend: The trend indicators suggest a strong bullish sentiment with all moving averages pointing upwards.
- Momentum: Momentum indicators confirm the bullish trend with overbought conditions, indicating a potential continuation of the upward movement.
- Volatility: Volatility indicators show an increase in volatility, which could lead to larger price swings.
- Volume: Volume indicators support the bullish trend, with increasing OBV and positive CMF.
Conclusion:
Based on the analysis of the technical indicators, the next few days' possible stock price movement for SMDV is likely to continue in an upward direction. The strong bullish trend, supported by momentum, volatility, and volume indicators, suggests that the stock is poised for further gains. Traders and investors may consider buying opportunities in anticipation of a continued uptrend.