Technical Analysis of SMDY 2024-05-10
Overview:
In analyzing the technical indicators for SMDY over the last 5 days, we will delve into the trends, momentum, volatility, and volume indicators to provide a comprehensive outlook on the possible stock price movement in the coming days. By examining key metrics such as moving averages, MACD, RSI, Bollinger Bands, and OBV, we aim to offer valuable insights and predictions for potential price action.
Trend Indicators:
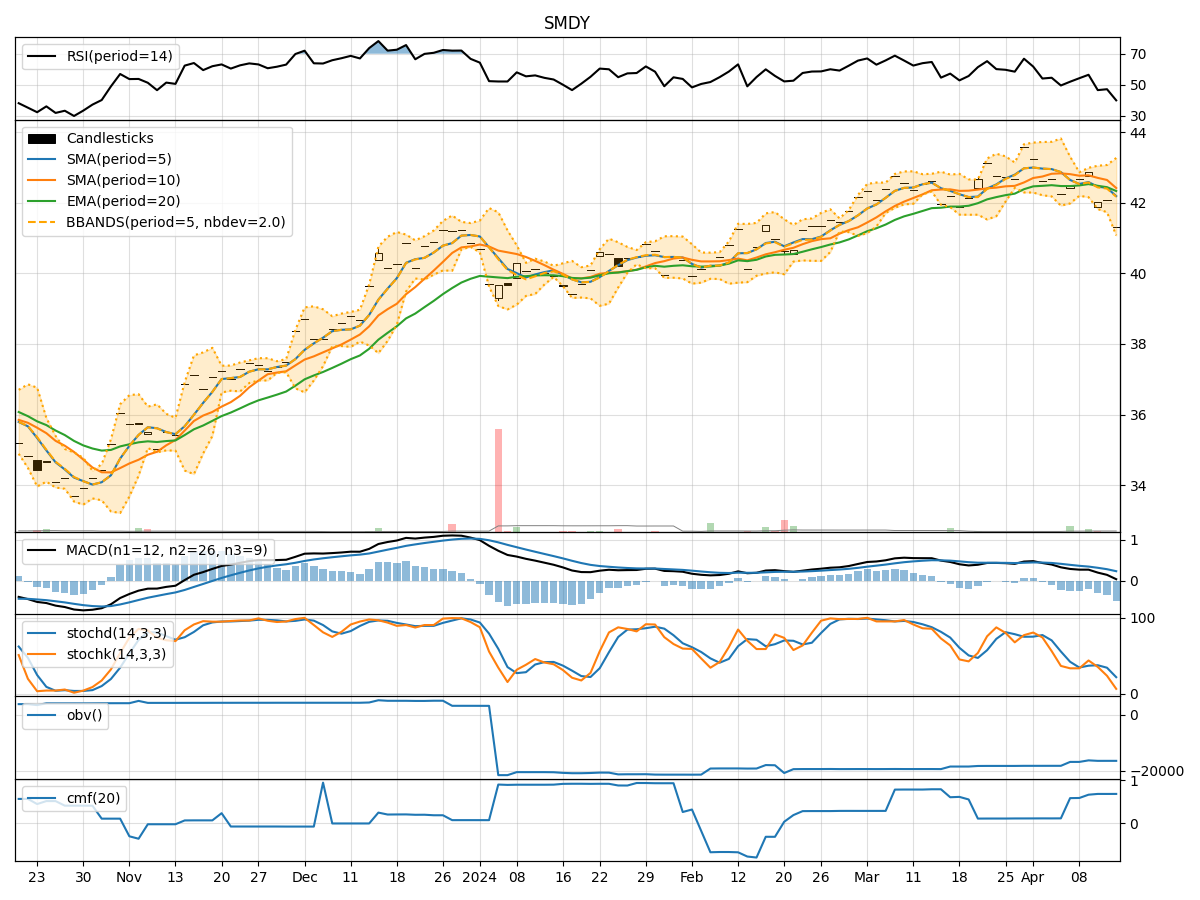
- Moving Averages (MA): The 5-day MA has been consistently above the closing prices, indicating a short-term uptrend.
- MACD: The MACD line has been trending upwards, with the MACD histogram showing positive values, suggesting bullish momentum.
- EMA: The EMA has been steadily increasing, supporting the bullish sentiment in the short to medium term.
Momentum Indicators:
- RSI: The RSI has been fluctuating around the 60-61 range, indicating a neutral momentum without extreme overbought or oversold conditions.
- Stochastic Oscillator: Both %K and %D have been relatively high, suggesting strong buying pressure.
- Williams %R: The indicator has been hovering around -3 to -10, indicating a potential overbought condition.
Volatility Indicators:
- Bollinger Bands (BB): The stock price has been trading within the bands, with the %B indicator showing values around 0.6 to 0.8, indicating moderate volatility.
- BB Width: The bands have shown slight contraction, suggesting a potential decrease in volatility in the short term.
Volume Indicators:
- On-Balance Volume (OBV): The OBV has remained relatively flat, indicating a balance between buying and selling pressure.
- Chaikin Money Flow (CMF): The CMF has been positive but decreasing, signaling a potential weakening of buying pressure.
Key Observations:
- The trend indicators suggest a bullish bias in the short to medium term.
- Momentum indicators show a neutral to slightly overbought condition.
- Volatility indicators point towards moderate volatility with a potential decrease in the short term.
- Volume indicators indicate a balance between buying and selling pressure, with a slight decrease in buying momentum.
Conclusion:
Based on the analysis of the technical indicators, the stock price of SMDY is likely to continue its upward trend in the coming days. The bullish sentiment supported by moving averages, MACD, and EMA signals a positive outlook. However, caution is advised as the momentum indicators show a potential overbought condition, and the volatility indicators suggest a slight decrease in volatility. Traders should monitor the price action closely for any signs of a reversal or consolidation.