Technical Analysis of SMIG 2024-05-10
Overview:
In analyzing the technical indicators for SMIG stock over the last 5 days, we will delve into the trend, momentum, volatility, and volume indicators to provide a comprehensive outlook on the possible stock price movement in the coming days.
Trend Indicators:
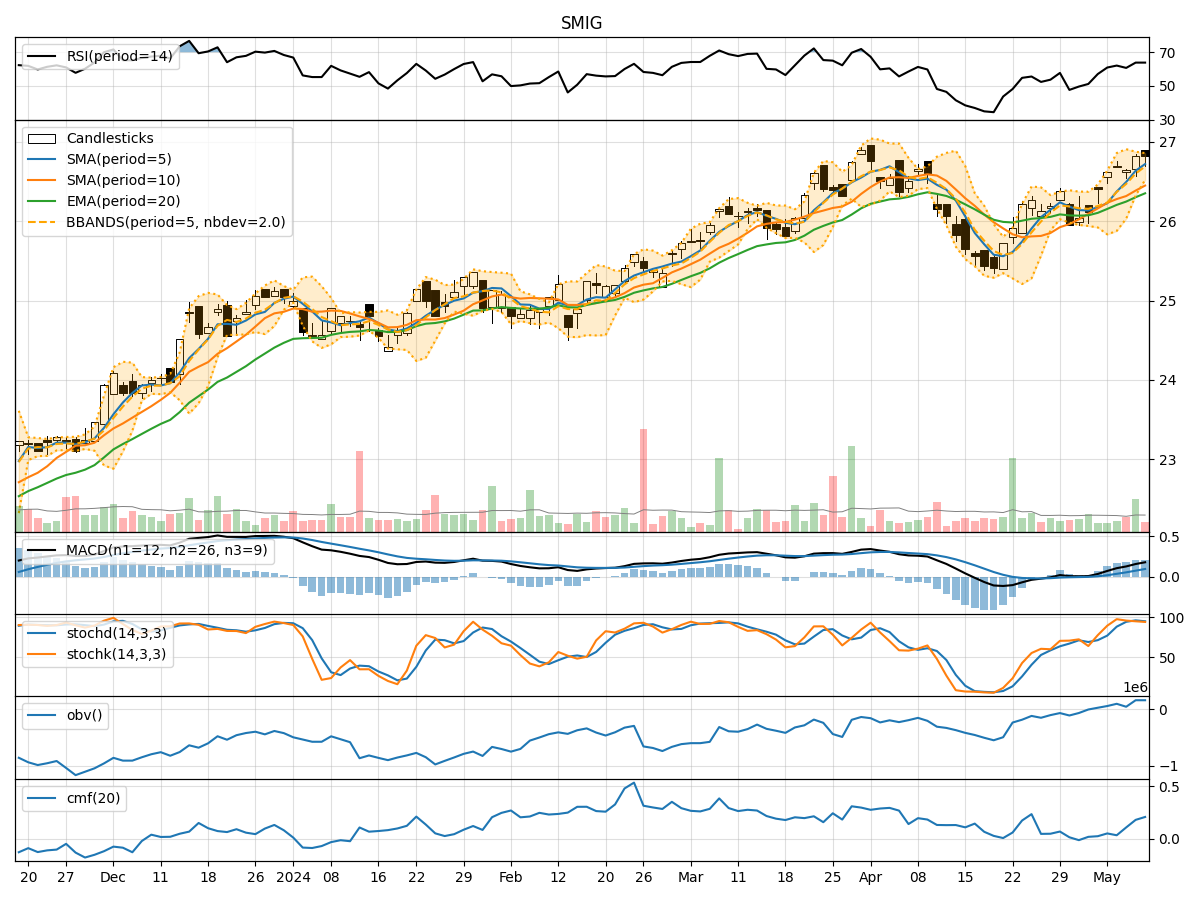
- Moving Averages (MA): The 5-day Moving Average has been consistently above the Simple Moving Average (SMA) and Exponential Moving Average (EMA), indicating a short-term uptrend.
- MACD: The MACD line has been above the signal line, with both lines showing an increasing positive trend, suggesting bullish momentum.
- Conclusion: The trend indicators point towards an upward movement in the stock price.
Momentum Indicators:
- RSI: The Relative Strength Index has been in the neutral to slightly overbought territory, indicating moderate buying pressure.
- Stochastic Oscillator: Both %K and %D have been in the overbought zone, suggesting a potential reversal or consolidation.
- Conclusion: The momentum indicators signal a cautious view as the stock may experience a short-term pullback or consolidation.
Volatility Indicators:
- Bollinger Bands: The stock price has been trading within the upper Bollinger Band, indicating increased volatility and a potential overbought condition.
- Conclusion: Volatility indicators suggest a potential pullback or sideways movement in the stock price.
Volume Indicators:
- On-Balance Volume (OBV): The OBV has shown mixed signals, with volume not confirming the recent price increase.
- Chaikin Money Flow (CMF): The CMF has been positive, indicating buying pressure.
- Conclusion: Volume indicators are inconclusive, but the CMF suggests a bullish bias.
Overall Conclusion:
Based on the analysis of trend, momentum, volatility, and volume indicators, the next few days for SMIG stock are likely to see a mixed price movement. While the trend indicators point towards an upward trajectory, momentum indicators suggest a cautious view with a potential for a short-term pullback or consolidation. Volatility indicators hint at a possible pullback or sideways movement, while volume indicators provide a bullish bias.
Key Recommendations:
- Monitor Closely: Keep a close eye on the stock price movement in the coming days, especially for signs of reversal or consolidation.
- Risk Management: Consider implementing risk management strategies to protect gains in case of a sudden downturn.
- Confirmation: Wait for confirmation from multiple indicators before making significant trading decisions.
- Consultation: Seek advice from financial advisors or experienced traders to gain additional insights tailored to your investment goals.
In summary, while the overall outlook is positive, it is essential to exercise caution and stay vigilant in response to changing market dynamics.