Technical Analysis of SMLE 2024-05-10
Overview:
In analyzing the technical indicators for SMLE over the last 5 days, we will delve into the trend, momentum, volatility, and volume indicators to provide a comprehensive outlook on the possible stock price movement in the coming days. By examining these key indicators, we aim to offer valuable insights and predictions for potential investors.
Trend Indicators:
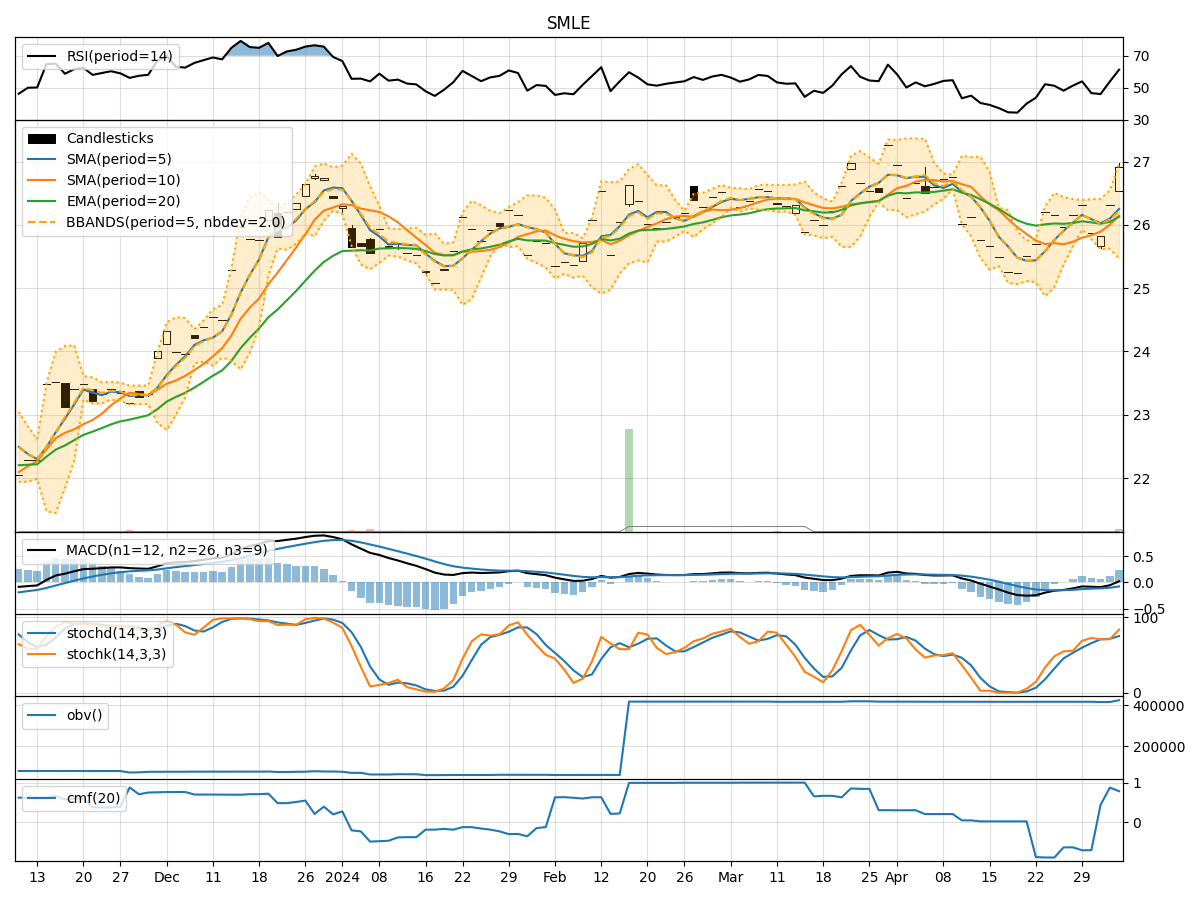
- Moving Averages (MA): The 5-day MA has been consistently above the 10-day SMA, indicating a short-term bullish trend. The EMA(20) has shown an upward trajectory, suggesting a positive momentum in the stock price.
- MACD: The MACD line has been above the signal line for the past few days, indicating a bullish trend. The MACD histogram has also been mostly positive, further supporting the bullish sentiment.
Momentum Indicators:
- RSI: The RSI(14) has been fluctuating around the 60-65 range, indicating a neutral momentum without extreme overbought or oversold conditions.
- Stochastic Oscillator: Both %K and %D have been gradually decreasing but still remain in the overbought territory, suggesting a potential reversal or consolidation phase.
- Williams %R: The Williams %R has been hovering around -6% to -7%, indicating a slightly oversold condition but not significantly impacting the overall momentum.
Volatility Indicators:
- Bollinger Bands: The stock price has mostly stayed within the Bollinger Bands, with the bands narrowing in recent days, indicating decreasing volatility.
- Bollinger %B: The %B indicator has been fluctuating around 0.5, suggesting the stock is trading near the middle band and not in extreme overbought or oversold conditions.
Volume Indicators:
- On-Balance Volume (OBV): The OBV has shown slight fluctuations but has not exhibited a clear trend, indicating mixed sentiment among investors.
- Chaikin Money Flow (CMF): The CMF(20) has been relatively stable around 0.77, suggesting consistent buying pressure over the past 20 days.
Key Observations and Opinions:
- Trend: The trend indicators suggest a bullish sentiment in the short term, supported by the moving averages and MACD.
- Momentum: The momentum indicators show a neutral stance with a slight inclination towards a potential consolidation or reversal.
- Volatility: Volatility has been decreasing, indicating a possible period of consolidation or a lack of significant price movements.
- Volume: The volume indicators reflect mixed sentiment, with no clear trend in buying or selling pressure.
Conclusion:
Based on the analysis of the technical indicators, the next few days for SMLE could see sideways movement or consolidation in the stock price. While the trend indicators point towards a bullish outlook, the momentum indicators suggest a potential reversal or consolidation phase. The decreasing volatility and mixed volume signals further support the view of a sideways movement. Investors should closely monitor key support and resistance levels for potential breakout opportunities.