Technical Analysis of SMLF 2024-05-10
Overview:
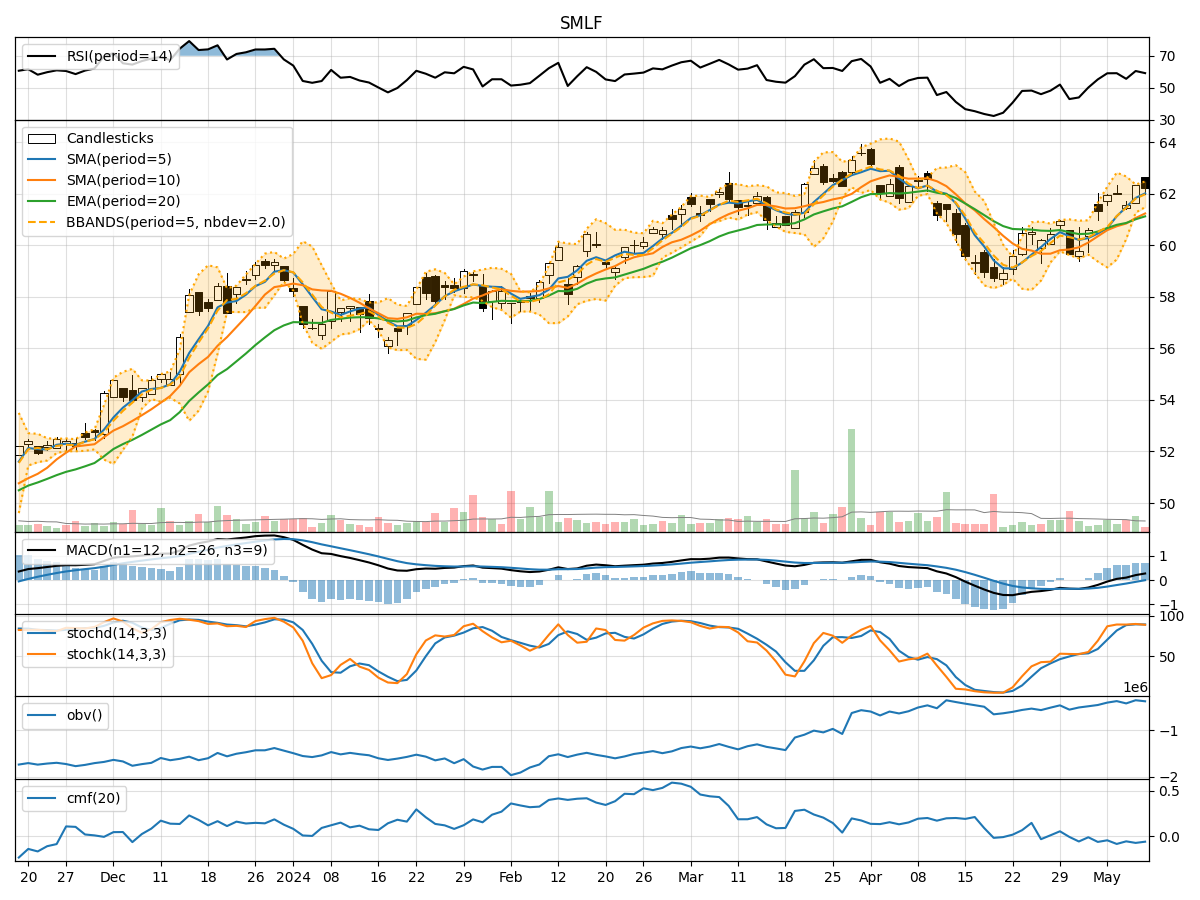
In the last 5 trading days, SMLF stock has shown mixed signals across various technical indicators. The trend indicators suggest a slightly bullish sentiment, with the moving averages trending upwards and the MACD showing positive momentum. However, the momentum indicators indicate a potential overbought condition, especially with the RSI reaching high levels. Volatility indicators show a narrowing of the Bollinger Bands, indicating a potential decrease in volatility. Volume indicators do not show a clear trend.
Trend Indicators:
- Moving Averages (MA): The 5-day MA is above the 10-day SMA, indicating a short-term bullish trend.
- MACD: The MACD line is above the signal line, suggesting positive momentum.
- EMA: The EMA is trending upwards, supporting a bullish view.
Momentum Indicators:
- RSI: The RSI is in the overbought territory, signaling a potential reversal or consolidation.
- Stochastic Oscillator: Both %K and %D are in the overbought zone, indicating a possible pullback.
- Williams %R: The indicator is in the oversold region, suggesting a potential reversal.
Volatility Indicators:
- Bollinger Bands: The bands are narrowing, indicating decreasing volatility and a potential consolidation phase.
Volume Indicators:
- On-Balance Volume (OBV): The OBV is relatively flat, not providing a clear direction.
- Chaikin Money Flow (CMF): The CMF is negative, indicating selling pressure.
Key Observations:
- The trend indicators suggest a bullish bias, while momentum indicators point to a potential reversal due to overbought conditions.
- Volatility is decreasing, which could lead to a period of consolidation.
- Volume indicators do not provide a clear signal, indicating uncertainty in market participation.
Conclusion:
Based on the analysis of the technical indicators, the next few days for SMLF stock could see a potential consolidation phase with a slight downward bias. The overbought conditions indicated by the momentum indicators suggest a possible pullback or sideways movement. The narrowing Bollinger Bands also support the view of decreased volatility and a period of consolidation. Traders should exercise caution and consider waiting for clearer signals before making significant trading decisions.