Technical Analysis of SMLV 2024-05-10
Overview:
In analyzing the technical indicators for SMLV over the last 5 days, we will delve into the trend, momentum, volatility, and volume indicators to provide a comprehensive outlook on the possible stock price movement in the coming days. By examining these key aspects, we aim to offer valuable insights and predictions for informed decision-making.
Trend Indicators:
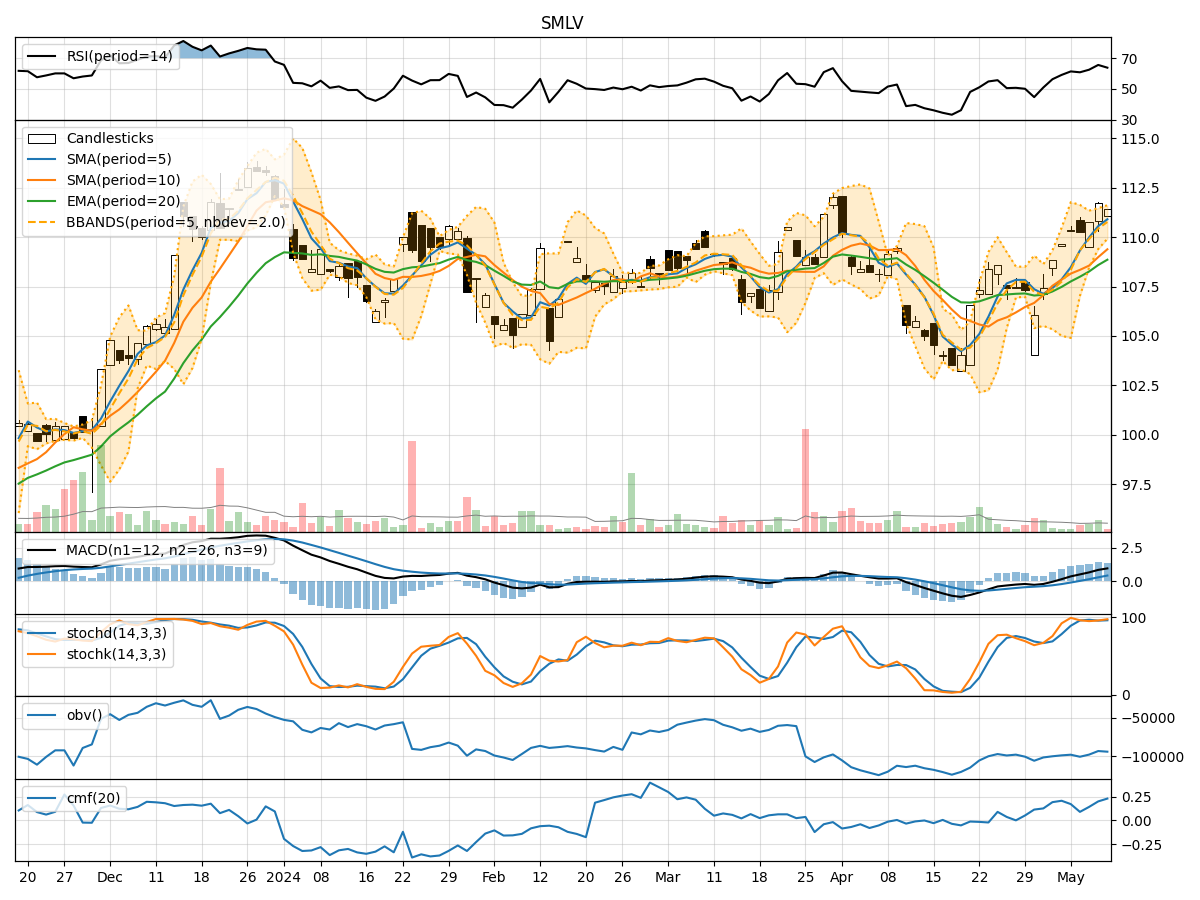
- Moving Averages (MA): The 5-day MA has been consistently above the longer-term SMAs and EMAs, indicating a bullish trend.
- MACD: The MACD line has been trending upwards, crossing above the signal line, suggesting increasing bullish momentum.
- MACD Histogram: The histogram has been positive, indicating strengthening bullish momentum.
Momentum Indicators:
- RSI: The RSI has been in the overbought territory, suggesting a potential pullback in the stock price.
- Stochastic Oscillator: Both %K and %D have been relatively high, indicating a strong bullish momentum.
- Williams %R: The indicator has been in the oversold region, signaling a potential reversal in the stock price.
Volatility Indicators:
- Bollinger Bands: The stock price has been trading within the bands, indicating a period of consolidation.
- Bollinger %B: The %B indicator has been hovering around 0.7, suggesting a neutral stance in terms of volatility.
Volume Indicators:
- On-Balance Volume (OBV): The OBV has shown an overall increase, indicating accumulation by investors.
- Chaikin Money Flow (CMF): The CMF has been positive, suggesting buying pressure in the stock.
Key Observations:
- The trend indicators point towards a bullish sentiment, supported by the moving averages and MACD.
- Momentum indicators show conflicting signals with RSI in overbought territory and Williams %R in oversold territory.
- Volatility indicators suggest a period of consolidation with the stock price trading within the Bollinger Bands.
- Volume indicators indicate accumulation and buying pressure in the stock.
Conclusion:
Based on the analysis of the technical indicators, the stock price of SMLV is likely to experience further upward movement in the coming days. The bullish trend supported by moving averages and MACD, along with positive volume indicators, indicates a favorable outlook. However, caution is advised due to conflicting signals from momentum indicators like RSI and Williams %R. Overall, the stock is expected to continue its upward trajectory with potential short-term fluctuations. Bullish bias is recommended for the next few days.