Technical Analysis of SMMD 2024-05-10
Overview:
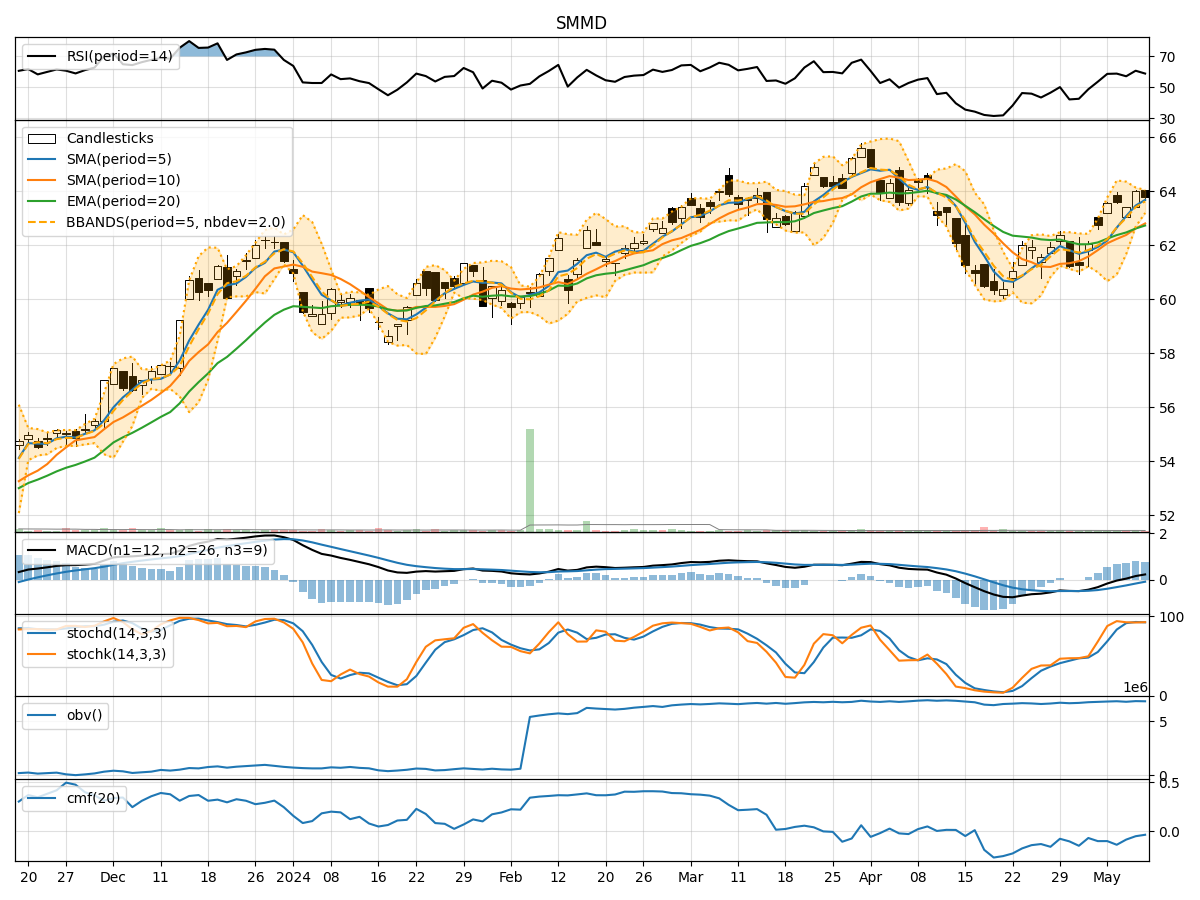
In the last 5 trading days, SMMD stock has shown mixed signals across various technical indicators. The trend indicators suggest a slightly bullish sentiment, with moving averages trending upwards. Momentum indicators indicate a neutral to slightly bullish momentum, while volatility indicators show decreasing volatility. Volume indicators also suggest a neutral sentiment with no significant divergence.
Trend Indicators Analysis:
- Moving Averages (MA): The 5-day moving average has been consistently above the 10-day simple moving average, indicating a short-term bullish trend.
- MACD: The MACD line has been above the signal line, suggesting a bullish momentum.
- EMA: The exponential moving average has been trending upwards, supporting the bullish sentiment.
Momentum Indicators Analysis:
- RSI: The Relative Strength Index has been fluctuating around the neutral zone, indicating a lack of strong momentum.
- Stochastic Oscillator: Both %K and %D lines have been in the overbought zone, suggesting a potential reversal or consolidation.
- Williams %R: The Williams %R indicator has been hovering around the oversold territory, indicating a potential buying opportunity.
Volatility Indicators Analysis:
- Bollinger Bands: The narrowing of the Bollinger Bands suggests decreasing volatility and a possible period of consolidation.
- Bollinger %B: The %B indicator is below 1, indicating that the price is currently below the upper Bollinger Band, potentially signaling a short-term pullback.
Volume Indicators Analysis:
- On-Balance Volume (OBV): The OBV has been relatively flat, indicating no significant divergence between price and volume.
- Chaikin Money Flow (CMF): The CMF has been negative, suggesting a slight outflow of money from the stock.
Conclusion:
Based on the analysis of the technical indicators, the next few days for SMMD stock are likely to see sideways movement with a slight bullish bias. The trend indicators support a bullish sentiment, while momentum indicators suggest a lack of strong momentum. Volatility indicators point towards a period of consolidation, and volume indicators indicate a neutral stance.
Key Conclusion: The stock is expected to trade within a narrow range in the upcoming days, with a potential for a slight upward movement. Traders may consider adopting a cautious approach and closely monitor key support and resistance levels for potential trading opportunities.