Technical Analysis of SMMV 2024-05-10
Overview:
In analyzing the technical indicators for SMMV over the last 5 days, we will delve into the trend, momentum, volatility, and volume indicators to provide a comprehensive outlook on the possible stock price movement in the coming days. By examining these key aspects, we aim to offer valuable insights and predictions to guide your investment decisions.
Trend Indicators:
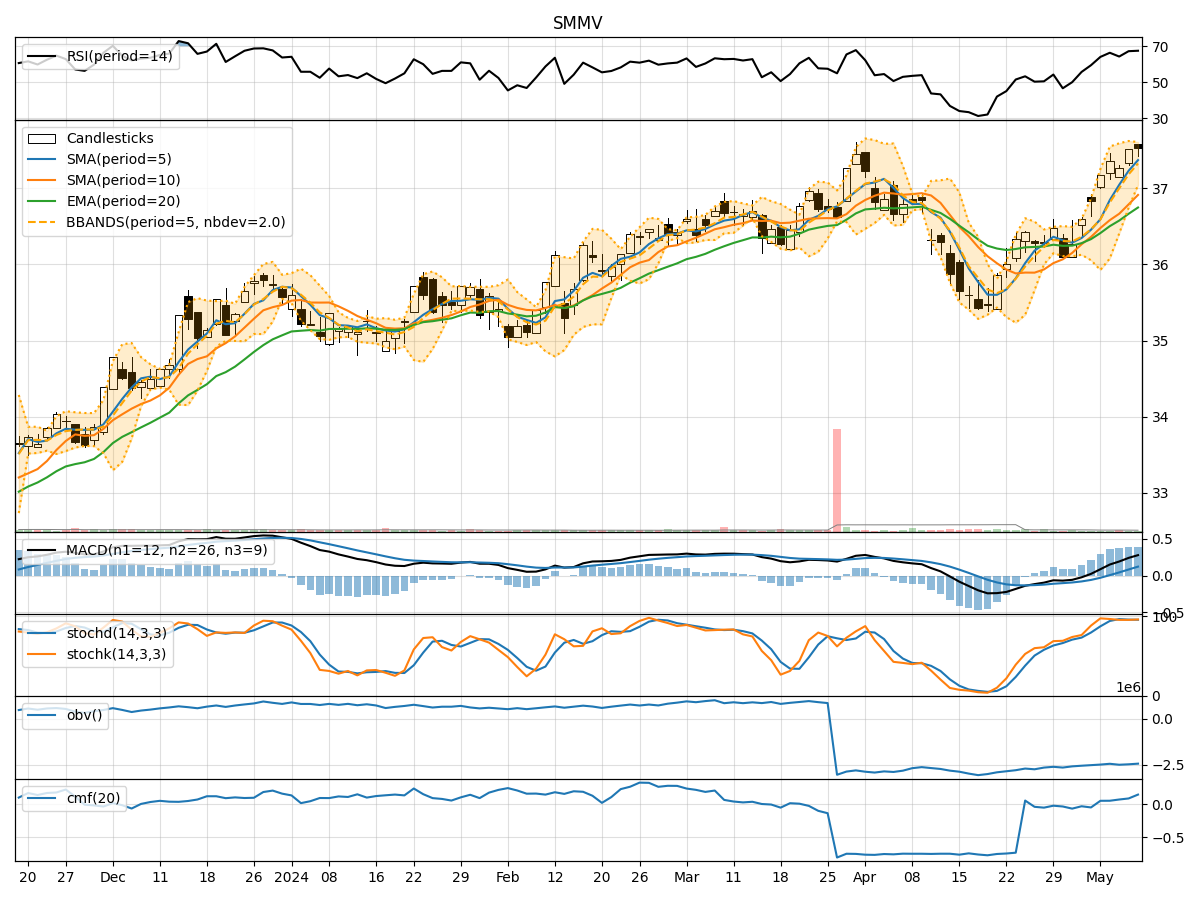
- Moving Averages (MA): The 5-day MA has been consistently above the longer-term SMAs and EMAs, indicating a bullish trend.
- MACD: The MACD line has been consistently above the signal line, suggesting upward momentum.
- MACD Histogram: The positive values of the MACD histogram indicate increasing bullish momentum.
Momentum Indicators:
- RSI: The RSI has been in the overbought territory, indicating a strong bullish momentum.
- Stochastic Oscillator: Both %K and %D have been in the overbought zone, signaling a potential reversal.
- Williams %R: The indicator has been fluctuating around the oversold region, suggesting a mixed sentiment.
Volatility Indicators:
- Bollinger Bands: The price has been trading within the bands, indicating a period of consolidation.
- Bollinger %B: The %B value has been hovering around the middle, reflecting a neutral stance on volatility.
Volume Indicators:
- On-Balance Volume (OBV): The OBV has shown a slight decline, indicating some distribution.
- Chaikin Money Flow (CMF): The CMF has been positive, suggesting buying pressure in the market.
Key Observations:
- The trend indicators point towards a strong bullish sentiment, supported by the moving averages and MACD.
- Momentum indicators show conflicting signals, with RSI indicating overbought conditions and stochastic oscillators hinting at a potential reversal.
- Volatility remains relatively stable, with Bollinger Bands suggesting a period of consolidation.
- Volume indicators reflect a slight decrease in buying pressure but overall positive money flow.
Conclusion:
Based on the analysis of the technical indicators, the stock price of SMMV is likely to experience further upward movement in the coming days. The bullish trend supported by moving averages and MACD signals a continuation of the positive momentum. However, caution is advised as the overbought conditions indicated by RSI and stochastic oscillators may lead to a short-term pullback or consolidation. Overall, the outlook remains bullish with a potential for minor corrections in the near term.