Technical Analysis of SMN 2024-05-10
Overview:
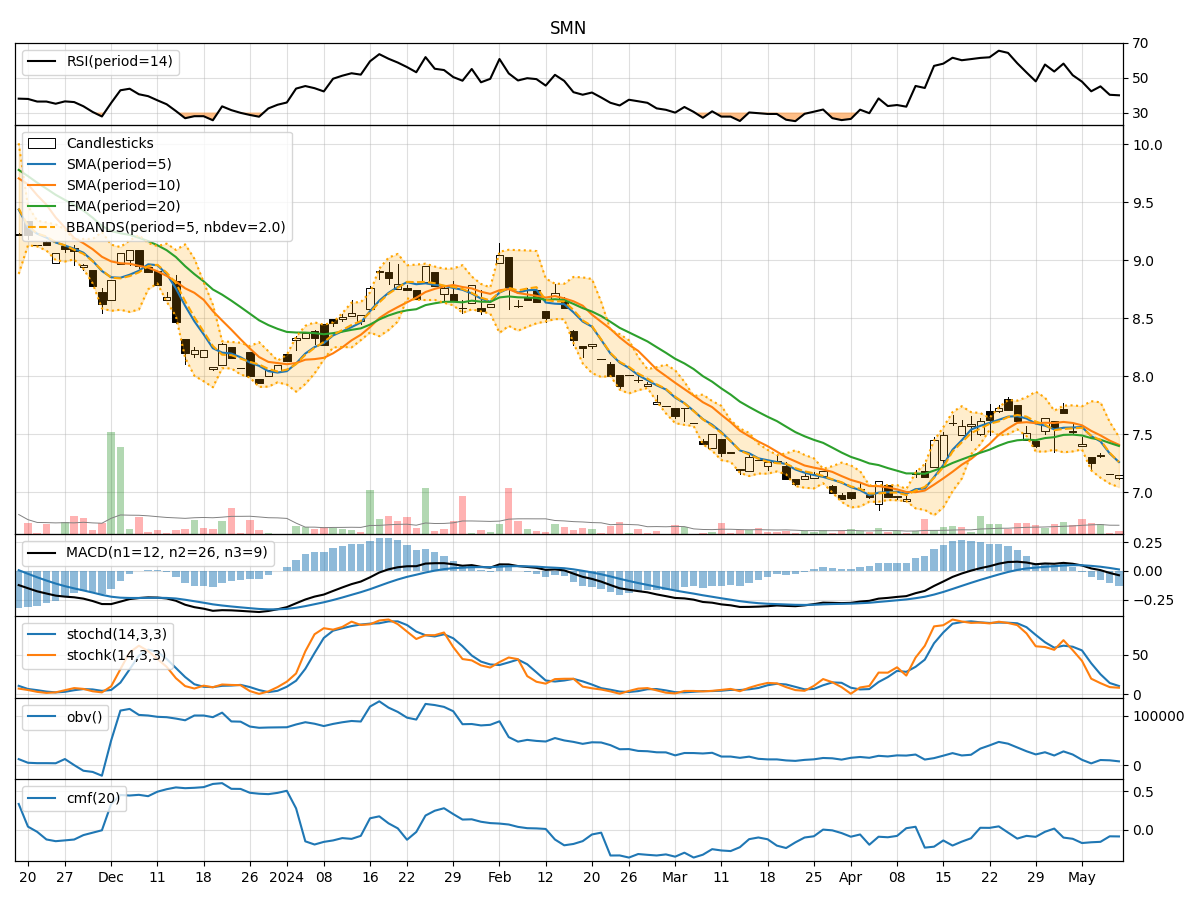
In analyzing the technical indicators for SMN stock over the last 5 days, we will delve into the trend, momentum, volatility, and volume indicators to provide a comprehensive outlook on the possible stock price movement in the coming days. By examining these key indicators, we aim to offer valuable insights and predictions for potential investors.
Trend Indicators:
- Moving Averages (MA): The 5-day MA has been consistently below the closing prices, indicating a short-term downtrend.
- MACD: The MACD line has been below the signal line, suggesting a bearish momentum.
- EMA: The EMA has been declining, further supporting the bearish trend.
Key Observation: The trend indicators point towards a bearish outlook for SMN stock.
Momentum Indicators:
- RSI: The RSI has been decreasing, indicating weakening momentum.
- Stochastic Oscillator: Both %K and %D have been trending downwards, signaling a potential oversold condition.
- Williams %R: The indicator has been in the oversold territory, suggesting a possible reversal.
Key Observation: Momentum indicators reflect a bearish sentiment with signs of potential reversal.
Volatility Indicators:
- Bollinger Bands (BB): The stock price has been trading within the lower Bollinger Band, indicating low volatility.
- Bollinger Band Width: The band width has been narrowing, suggesting a decrease in volatility.
- Bollinger Band %B: The %B indicator has been below 0.2, indicating an oversold condition.
Key Observation: Volatility indicators signal a sideways movement with a potential for a reversal.
Volume Indicators:
- On-Balance Volume (OBV): The OBV has been declining, indicating selling pressure.
- Chaikin Money Flow (CMF): The CMF has been negative, suggesting outflow of money from the stock.
Key Observation: Volume indicators support the bearish sentiment with continued selling pressure.
Conclusion:
Based on the analysis of trend, momentum, volatility, and volume indicators, the overall outlook for SMN stock in the next few days is bearish with a potential for a sideways movement. Investors should exercise caution and consider waiting for a clearer signal before making any trading decisions. It is advisable to closely monitor the price action and key support levels for any signs of a reversal or trend confirmation.
Key Recommendations:
- Short-Term Traders: Consider shorting the stock or waiting for a clear reversal signal before entering a long position.
- Long-Term Investors: Monitor the stock closely and wait for a more favorable entry point to mitigate risks.
- Risk Management: Implement strict stop-loss orders to protect capital in case of adverse price movements.
In conclusion, the technical analysis suggests a bearish outlook for SMN stock in the near term, with a possibility of sideways movement. It is crucial for investors to conduct further research and consider multiple factors before making any investment decisions.