Technical Analysis of SMRI 2024-05-10
Overview:
In analyzing the provided SMRI TA data for the last 5 days, we will delve into the technical indicators across trend, momentum, volatility, and volume to derive insights into the possible future stock price movement. By examining these indicators comprehensively, we aim to provide a well-informed prediction backed by data-driven analysis and expert interpretation.
Trend Analysis:
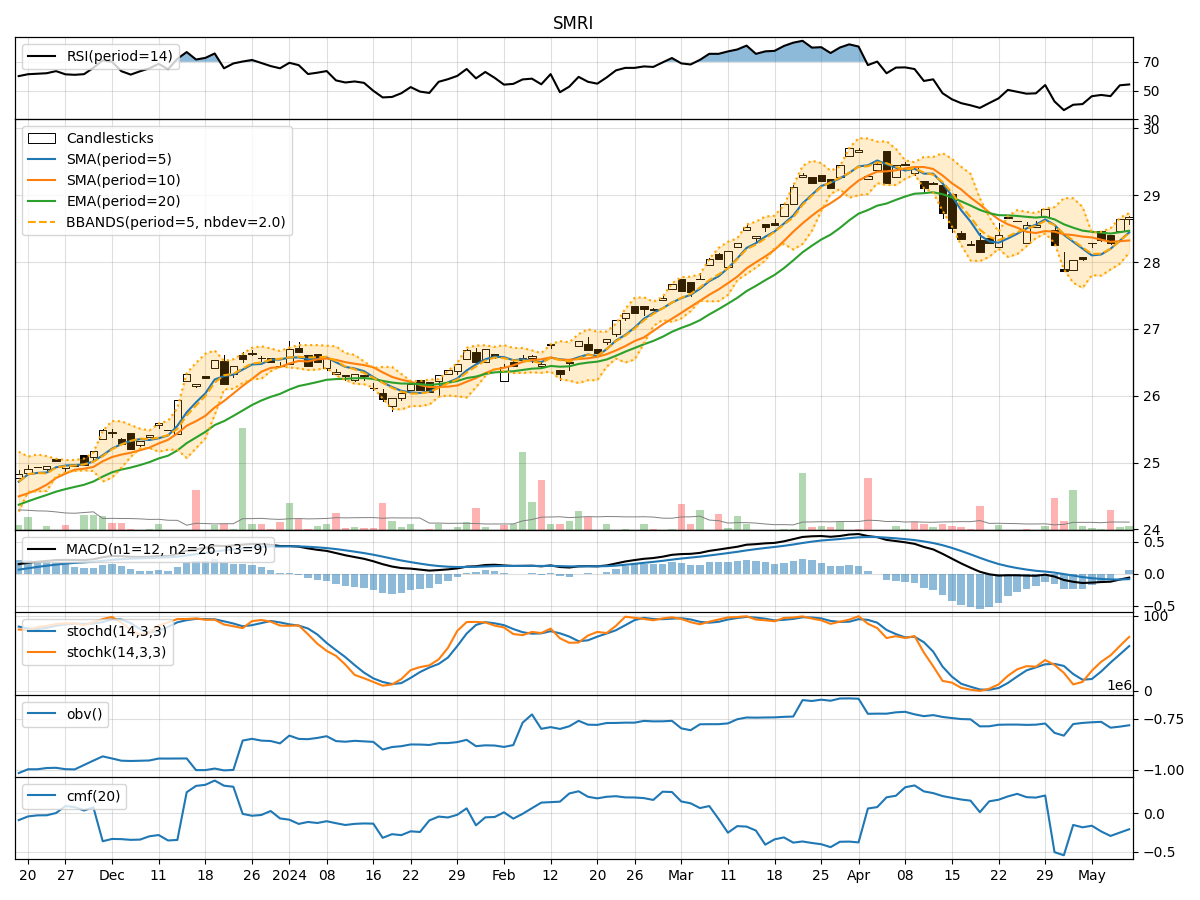
- Moving Averages (MA): The 5-day MA has been fluctuating around the closing prices, indicating short-term price trends. The SMA(10) and EMA(20) have shown a slight decline, suggesting a weakening trend.
- MACD: The MACD line has been negative, with the MACD histogram showing a slight uptrend. This indicates a potential reversal in the short term.
Momentum Analysis:
- RSI: The RSI has been hovering around the mid-level, indicating a neutral momentum in the stock.
- Stochastic Oscillator: Both %K and %D have been rising, suggesting increasing buying pressure.
- Williams %R: The indicator has been moving towards oversold levels, indicating a potential buying opportunity.
Volatility Analysis:
- Bollinger Bands: The stock price has been trading within the bands, with the %B indicator showing fluctuations. This suggests a period of consolidation.
Volume Analysis:
- On-Balance Volume (OBV): The OBV has been fluctuating, indicating indecision among investors.
- Chaikin Money Flow (CMF): The CMF has been negative, reflecting selling pressure in the stock.
Key Observations and Opinions:
- Trend: The trend indicators suggest a weakening trend in the short term.
- Momentum: Momentum indicators show a neutral to slightly bullish sentiment.
- Volatility: Volatility indicators point towards a period of consolidation.
- Volume: Volume indicators reflect indecision and selling pressure in the market.
Conclusion:
Based on the analysis of the technical indicators, the stock is likely to experience sideways movement in the next few days. The trend is showing signs of weakness, while momentum remains neutral with a slight bullish bias. Volatility indicates a period of consolidation, and volume suggests indecision among investors. Therefore, it is recommended to exercise caution and closely monitor the stock for any potential breakout or reversal signals before making any trading decisions.