Technical Analysis of SNOV 2024-05-10
Overview:
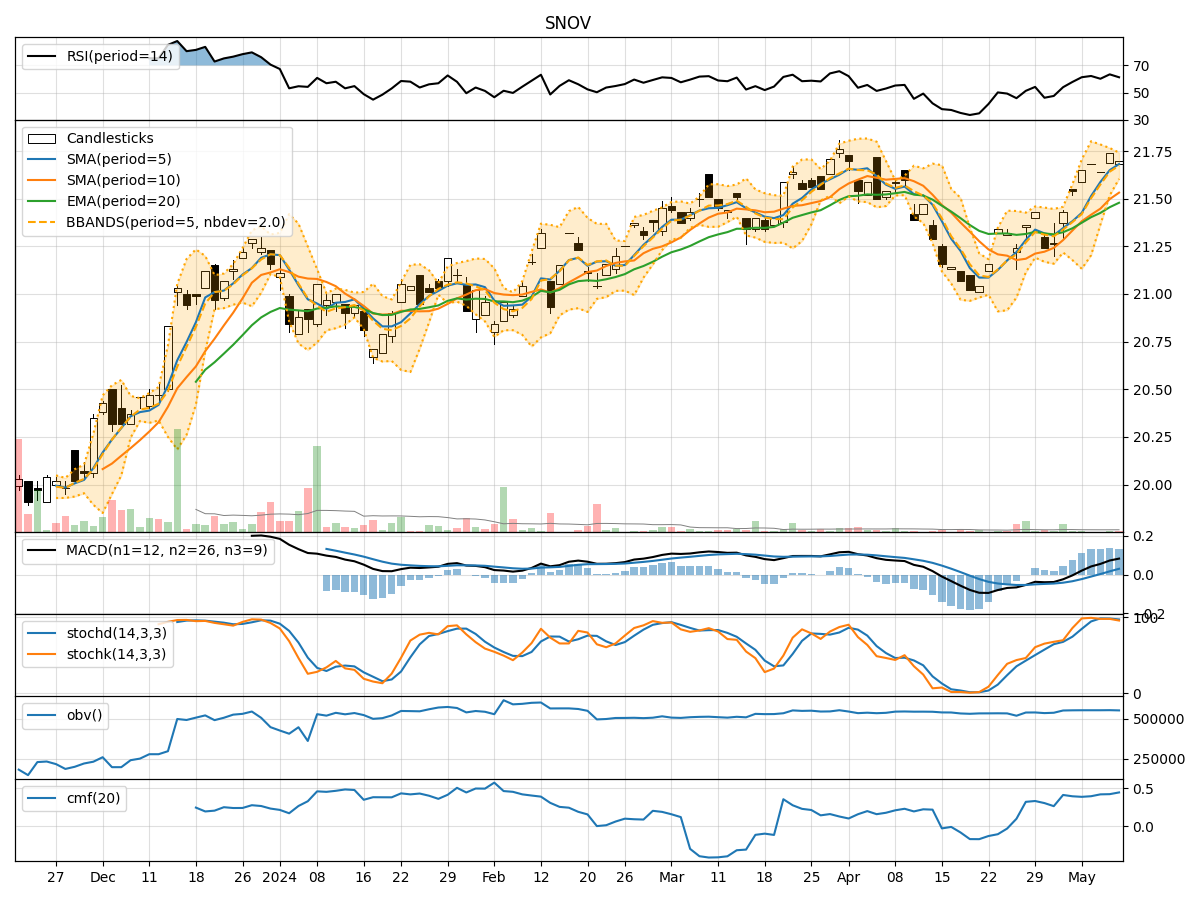
In analyzing the technical indicators for SNOV over the last 5 days, we will delve into the trend, momentum, volatility, and volume indicators to provide a comprehensive outlook on the possible stock price movement. By examining these key aspects, we aim to offer valuable insights and predictions for the upcoming days.
Trend Indicators:
- Moving Averages (MA): The 5-day MA has been consistently above the closing price, indicating a bullish trend.
- MACD: The MACD line has been above the signal line, suggesting a positive momentum in the stock price.
- MACD Histogram: The histogram has been increasing, indicating strengthening bullish momentum.
Momentum Indicators:
- RSI: The RSI has been fluctuating around the 60-63 range, suggesting a neutral momentum.
- Stochastic Oscillator: Both %K and %D have been relatively high, indicating overbought conditions.
- Williams %R: The indicator has been hovering around -6% to 0%, signaling a potential overbought scenario.
Volatility Indicators:
- Bollinger Bands (BB): The stock price has been trading within the bands, with the bands narrowing, indicating decreasing volatility.
- Bollinger %B: The %B has been fluctuating around 0.6 to 0.8, suggesting the stock is trading closer to the upper band.
Volume Indicators:
- On-Balance Volume (OBV): The OBV has shown mixed signals, with slight fluctuations in volume.
- Chaikin Money Flow (CMF): The CMF has been gradually increasing, indicating buying pressure in the stock.
Key Observations:
- The trend indicators suggest a bullish sentiment with the MA and MACD supporting upward momentum.
- Momentum indicators show a neutral to slightly overbought condition, indicating a potential slowdown in price movement.
- Volatility indicators point towards decreasing volatility, potentially leading to a consolidation phase.
- Volume indicators reflect mixed signals, with OBV showing slight fluctuations and CMF indicating buying pressure.
Conclusion:
Based on the analysis of the technical indicators, the next few days for SNOV could see sideways movement or consolidation in the stock price. The bullish trend supported by moving averages and MACD may face resistance due to overbought conditions indicated by momentum indicators. Decreasing volatility suggests a possible period of consolidation, while volume indicators show mixed signals. Traders should closely monitor key support and resistance levels for potential entry or exit points.