Technical Analysis of SNPV 2024-05-10
Overview:
In analyzing the technical indicators for SNPV over the last 5 days, we will delve into the trend, momentum, volatility, and volume indicators to provide a comprehensive outlook on the possible stock price movement in the coming days. By examining these key indicators, we aim to offer valuable insights and predictions to guide investment decisions.
Trend Analysis:
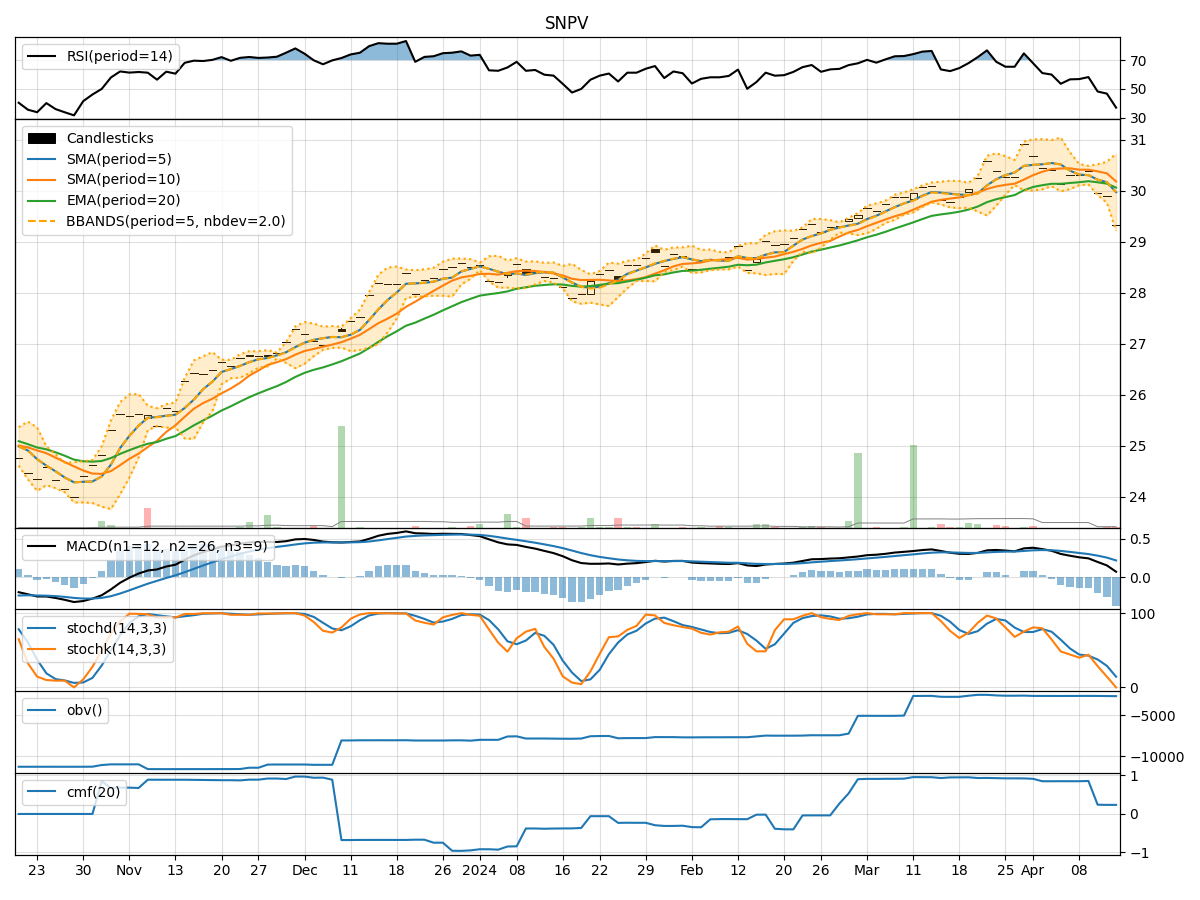
- Moving Averages (MA): The 5-day MA has been consistently above the closing prices, indicating a short-term uptrend.
- MACD: The MACD line has been positive, with the MACD histogram showing an increasing trend, suggesting bullish momentum.
Momentum Analysis:
- RSI: The RSI has been trending upwards, indicating increasing buying pressure.
- Stochastic Oscillator: Both %K and %D have been at or near 100%, signaling overbought conditions.
Volatility Analysis:
- Bollinger Bands (BB): The stock price has been consistently trading above the middle Bollinger Band, suggesting an upward trend with moderate volatility.
Volume Analysis:
- On-Balance Volume (OBV): The OBV has been relatively flat, indicating a balance between buying and selling pressure.
- Chaikin Money Flow (CMF): The CMF has been negative, reflecting a lack of buying interest.
Key Observations:
- The trend indicators suggest a bullish sentiment with the moving averages and MACD signaling upward momentum.
- Momentum indicators show overbought conditions, which may lead to a potential pullback or consolidation.
- Volatility remains moderate, indicating a steady but not excessive price movement.
- Volume indicators reflect a lack of significant buying interest, potentially limiting the stock's upside potential.
Conclusion:
Based on the technical analysis of SNPV, the stock is currently in an upward trend with bullish momentum. However, the overbought conditions indicated by the momentum indicators and the lack of significant buying interest in the volume indicators suggest a possible short-term consolidation or pullback in the stock price. Traders should exercise caution and consider waiting for a better entry point before initiating new long positions.