Technical Analysis of SNSR 2024-05-10
Overview:
In analyzing the technical indicators for SNSR over the last 5 days, we will delve into the trend, momentum, volatility, and volume indicators to provide a comprehensive outlook on the possible stock price movement in the coming days.
Trend Analysis:
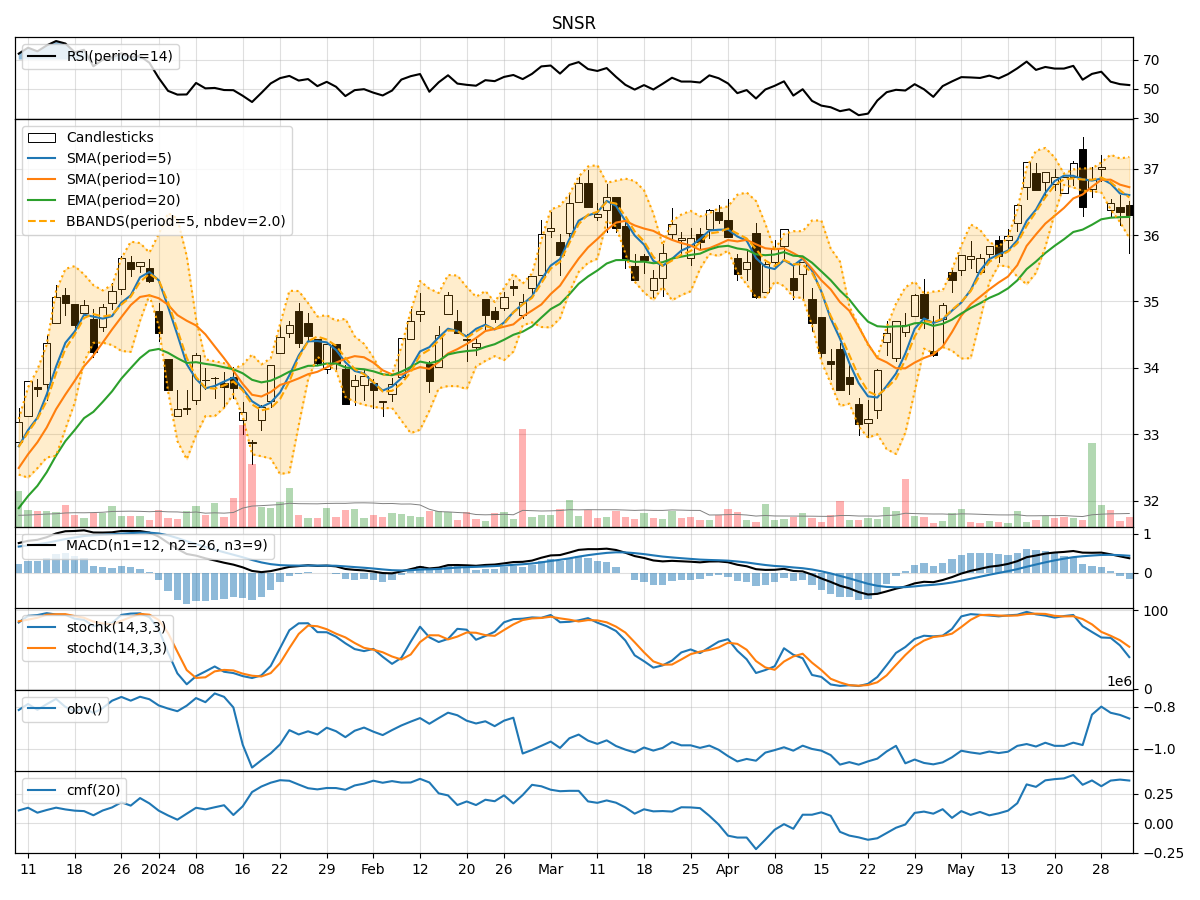
- Moving Averages (MA): The 5-day Moving Average (MA) has been consistently above the Simple Moving Average (SMA) and Exponential Moving Average (EMA), indicating a bullish trend.
- MACD: The MACD line has been consistently above the signal line, with the MACD Histogram showing positive values, further supporting the bullish trend.
Momentum Analysis:
- RSI: The Relative Strength Index (RSI) has been fluctuating around the 50 level, suggesting a neutral momentum in the stock.
- Stochastic Oscillator: Both %K and %D have been hovering in the overbought territory, indicating a potential reversal or consolidation phase.
Volatility Analysis:
- Bollinger Bands (BB): The stock price has been trading within the Bollinger Bands, with the bands narrowing, indicating decreasing volatility.
- Bollinger %B: The %B indicator has been fluctuating around the midline, suggesting a lack of clear direction in price movement.
Volume Analysis:
- On-Balance Volume (OBV): The OBV has been showing a slight decrease over the last few days, indicating a divergence between price and volume.
- Chaikin Money Flow (CMF): The CMF has been relatively stable around the zero line, indicating a balance between buying and selling pressure.
Conclusion:
Based on the analysis of the technical indicators, the stock of SNSR is currently in a consolidation phase with neutral momentum. The trend remains bullish based on moving averages and MACD, but the overbought levels in the Stochastic Oscillator suggest a potential reversal or sideways movement in the near term. The decreasing volatility and lack of clear direction in volume indicators further support the view of a sideways movement.
Recommendation:
Considering the mixed signals from the technical indicators, it is advisable for investors to exercise caution and wait for more clarity in price action before making any significant trading decisions. Monitoring the Stochastic Oscillator for a potential reversal signal and observing any breakout from the Bollinger Bands can provide valuable insights for future price movements. It is essential to combine technical analysis with fundamental research to make well-informed investment decisions.