Technical Analysis of SOCL 2024-05-10
Overview:
In analyzing the technical indicators for the SOCL stock over the last 5 days, we will delve into the trend, momentum, volatility, and volume indicators to provide a comprehensive outlook on the possible stock price movement in the coming days. By examining these key indicators, we aim to offer valuable insights and predictions to guide investment decisions.
Trend Indicators:
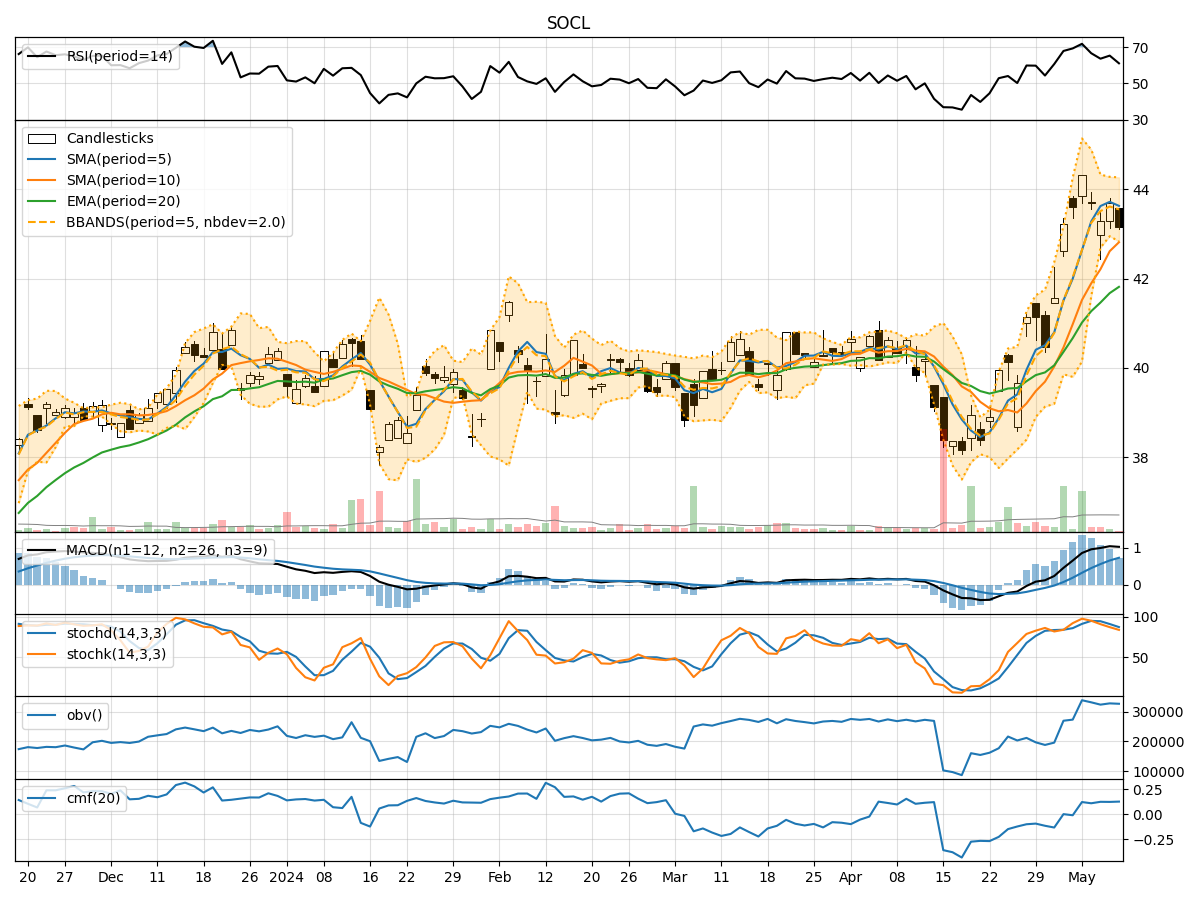
- Moving Averages (MA): The 5-day Moving Average (MA) has been consistently above the Simple Moving Average (SMA) and Exponential Moving Average (EMA), indicating a bullish trend.
- MACD: The MACD line has been above the signal line, with both lines showing an upward trend, suggesting bullish momentum.
- MACD Histogram: The MACD Histogram has been increasing, indicating strengthening bullish momentum.
Momentum Indicators:
- RSI: The Relative Strength Index (RSI) has been fluctuating in the overbought territory, suggesting a strong bullish momentum.
- Stochastic Oscillator: Both %K and %D lines of the Stochastic Oscillator have been in the overbought zone, indicating a strong bullish sentiment.
- Williams %R: The Williams %R has been consistently in the oversold region, signaling a strong bullish sentiment.
Volatility Indicators:
- Bollinger Bands: The Bollinger Bands have been narrowing, indicating decreasing volatility and a potential price breakout.
- Bollinger %B: The %B indicator has been hovering around the middle range, suggesting a neutral stance in terms of volatility.
Volume Indicators:
- On-Balance Volume (OBV): The OBV has shown a slight increase over the last 5 days, indicating a positive accumulation of volume.
- Chaikin Money Flow (CMF): The CMF has been relatively stable around the zero line, indicating a balance between buying and selling pressure.
Key Observations and Opinions:
- Trend: The trend indicators suggest a strong bullish sentiment, supported by the moving averages and MACD analysis.
- Momentum: The momentum indicators reflect a robust bullish momentum, with RSI and Stochastic Oscillator signaling overbought conditions.
- Volatility: The narrowing Bollinger Bands indicate a potential price breakout, while the %B remains neutral, suggesting a possible consolidation phase.
- Volume: The volume indicators show a slight increase in accumulation, indicating positive sentiment among investors.
Conclusion:
Based on the analysis of the technical indicators, the next few days are likely to see a continuation of the bullish trend in the SOCL stock. The strong momentum, supported by the trend indicators, suggests further upside potential. Traders and investors may consider buying opportunities in anticipation of a potential price breakout. It is essential to monitor the price action closely for any signs of reversal or consolidation.