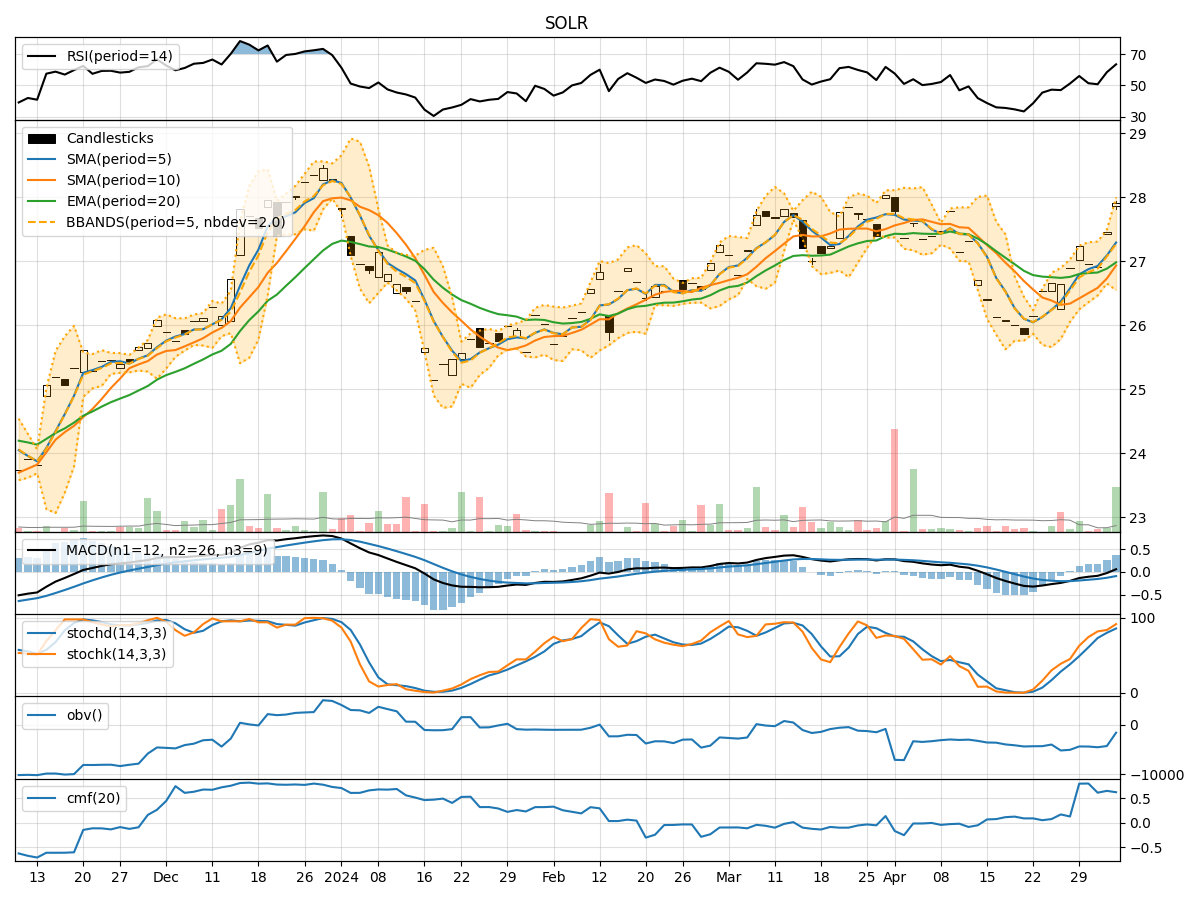
Technical Analysis of SOLR 2024-05-10
Overview:
In the last 5 trading days, SOLR stock has shown a consistent uptrend in its price, accompanied by increasing volumes. The trend indicators, momentum indicators, volatility indicators, and volume indicators all point towards a bullish sentiment in the market. However, it is essential to delve deeper into each category of indicators to provide a comprehensive analysis and make an informed prediction about the possible stock price movement in the next few days.
Trend Indicators:
- Moving Averages (MA): The moving averages (MA) have been steadily increasing, indicating a positive trend in the stock price.
- MACD: The MACD line has been consistently above the signal line, suggesting a bullish momentum in the stock.
- EMA: The exponential moving average (EMA) has been trending upwards, further supporting the bullish sentiment.
Momentum Indicators:
- RSI: The Relative Strength Index (RSI) is in the overbought territory, indicating a strong buying momentum in the stock.
- Stochastic Oscillator: Both %K and %D lines are near 100, signaling a strong bullish momentum.
- Williams %R: The Williams %R is in the oversold region, suggesting a potential reversal in the stock price.
Volatility Indicators:
- Bollinger Bands: The Bollinger Bands are narrowing, indicating decreasing volatility and a possible consolidation phase.
- Bollinger %B: The %B is below 1, suggesting the stock is trading below the upper Bollinger Band.
Volume Indicators:
- On-Balance Volume (OBV): The OBV has been fluctuating but overall showing a positive trend, indicating accumulation by investors.
- Chaikin Money Flow (CMF): The CMF is above 0.5, indicating buying pressure in the stock.
Key Observations and Opinions:
- Trend: The stock is in a strong uptrend, supported by moving averages and MACD.
- Momentum: The momentum indicators suggest a strong bullish sentiment in the market.
- Volatility: The narrowing Bollinger Bands indicate a potential consolidation phase.
- Volume: The increasing OBV and positive CMF suggest accumulation and buying pressure.
Conclusion:
Based on the analysis of the technical indicators, the next few days' possible stock price movement for SOLR is likely to continue in an upward direction. The bullish trend, strong momentum, and positive volume indicators all point towards further price appreciation. However, traders should be cautious of a potential consolidation phase indicated by the narrowing Bollinger Bands. Overall, the outlook for SOLR stock remains bullish in the short term.