Technical Analysis of SOVF 2024-05-10
Overview:
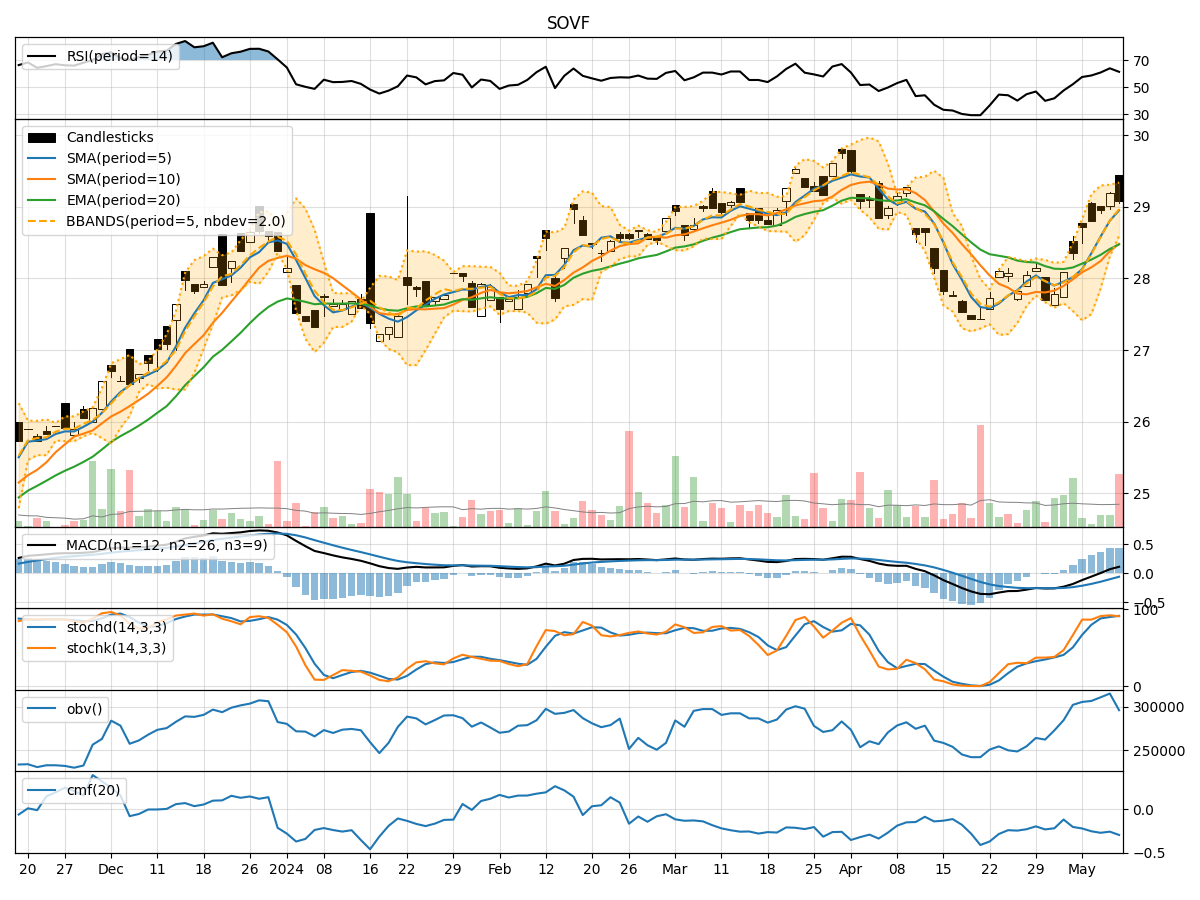
In analyzing the technical indicators for SOVF over the last 5 days, we will delve into the trend, momentum, volatility, and volume indicators to provide a comprehensive outlook on the possible stock price movement. By examining these key aspects, we aim to offer valuable insights and predictions for the upcoming days.
Trend Analysis:
- Moving Averages (MA): The 5-day MA has been consistently above the closing prices, indicating a short-term uptrend.
- MACD: The MACD line has been above the signal line, suggesting bullish momentum.
- RSI: The RSI has been trending upwards, reflecting increasing buying pressure.
Key Observation: The trend indicators point towards a bullish sentiment in the short term.
Momentum Analysis:
- Stochastic Oscillator: Both %K and %D have been in the overbought zone, signaling potential overextension.
- Williams %R: The indicator has been in the oversold territory, indicating a possible reversal.
Key Observation: Momentum indicators suggest a potential pullback or consolidation in the near future.
Volatility Analysis:
- Bollinger Bands (BB): The bands have been narrowing, indicating decreasing volatility.
Key Observation: Volatility is decreasing, which could lead to a period of consolidation or range-bound trading.
Volume Analysis:
- On-Balance Volume (OBV): The OBV has shown mixed movements, indicating indecision among market participants.
- Chaikin Money Flow (CMF): The CMF has been negative, suggesting selling pressure.
Key Observation: Volume indicators reflect a lack of strong conviction in the market.
Conclusion:
Based on the analysis of the technical indicators, the stock price of SOVF is likely to experience a short-term bullish trend with potential for a pullback or consolidation due to overbought conditions in momentum indicators. The decreasing volatility and mixed volume signals further support the expectation of a sideways movement in the upcoming days. Traders should be cautious of potential reversals and monitor key support and resistance levels for strategic entry and exit points.
Recommendation:
- Short-term Traders: Consider taking profits on existing long positions and wait for a potential pullback to re-enter.
- Long-term Investors: Monitor the price action for a clearer trend confirmation before making significant investment decisions.
By combining insights from trend, momentum, volatility, and volume indicators, traders can make well-informed decisions aligned with the current market dynamics.