Technical Analysis of SPAM 2024-05-10
Overview:
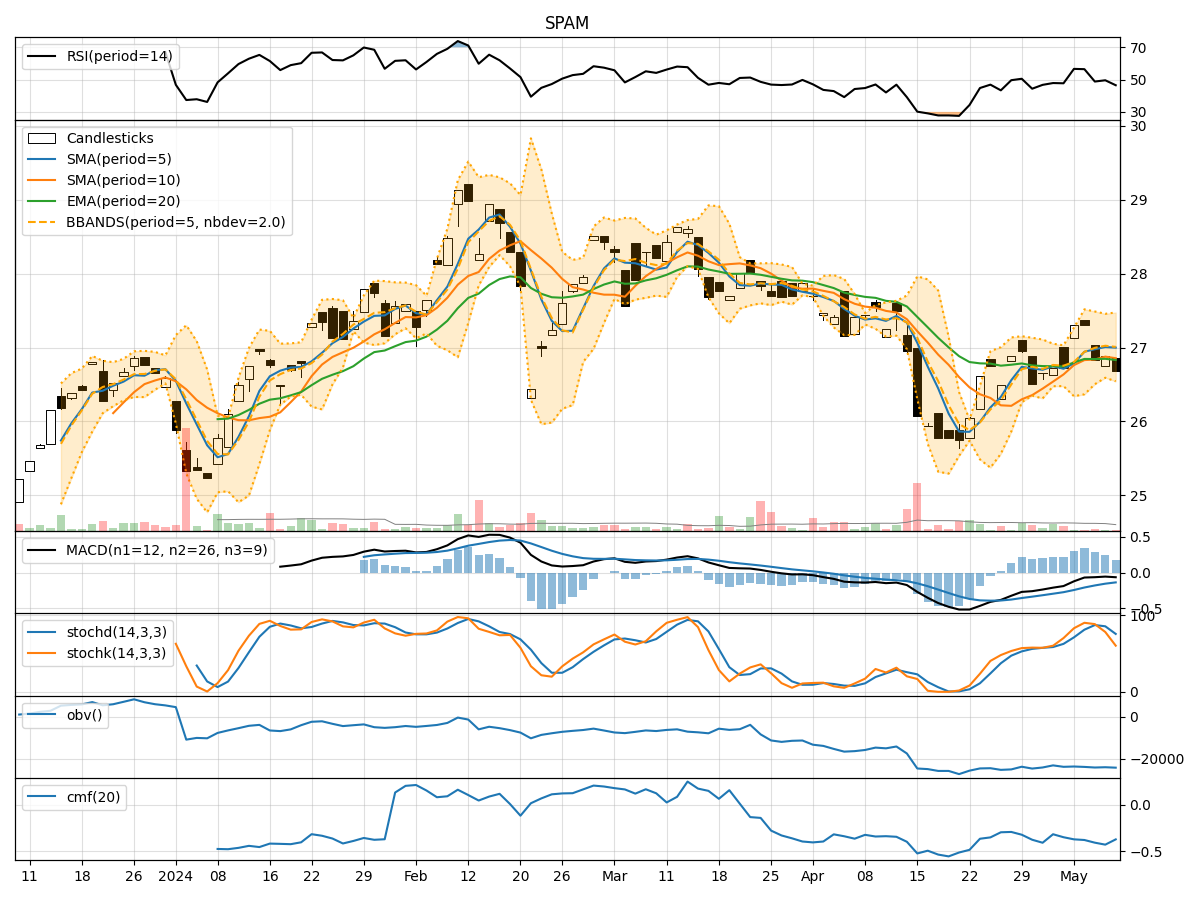
In the last 5 trading days, the stock price of SPAM has shown some fluctuations with a slight downward trend. Various technical indicators such as Moving Averages, MACD, RSI, Stochastic Oscillator, Bollinger Bands, and Volume indicators provide insights into the stock's potential future movements. Let's analyze each category of indicators to determine the possible next few days' stock price movement.
Trend Indicators:
- Moving Averages (MA): The 5-day Moving Average (MA) is slightly above the closing prices, indicating a short-term upward trend. However, the Simple Moving Average (SMA) and Exponential Moving Average (EMA) suggest a neutral to slightly bearish trend.
- MACD: The MACD line is below the signal line, indicating a bearish signal. The MACD Histogram is also negative, suggesting a bearish momentum.
Momentum Indicators:
- RSI: The Relative Strength Index (RSI) is around 50, indicating a neutral momentum with no clear overbought or oversold conditions.
- Stochastic Oscillator: Both %K and %D are below 80, suggesting a bearish momentum. The Williams %R is also in the oversold territory, indicating a potential reversal.
Volatility Indicators:
- Bollinger Bands (BB): The stock price is currently trading near the lower Bollinger Band, indicating a potential oversold condition. The bands are narrowing, suggesting a decrease in volatility.
Volume Indicators:
- On-Balance Volume (OBV): The OBV is showing a slight decrease, indicating a potential distribution phase.
- Chaikin Money Flow (CMF): The CMF is negative, suggesting a bearish money flow.
Key Observations and Opinions:
- The trend indicators show a mixed signal with a slight bearish bias due to the negative MACD and SMA.
- Momentum indicators suggest a neutral to bearish momentum, with the Stochastic Oscillator indicating a potential reversal.
- Volatility indicators point towards a decrease in volatility and a potential oversold condition based on the Bollinger Bands.
- Volume indicators indicate a slight distribution phase with negative OBV and CMF.
Conclusion:
Based on the analysis of technical indicators, the next few days' possible stock price movement for SPAM is likely to be sideways to slightly bearish. The stock may experience some consolidation near the current levels before potentially resuming a downward trend. Traders should exercise caution and consider waiting for clearer signals before making any significant trading decisions.