Technical Analysis of SPAQ 2024-05-10
Overview:
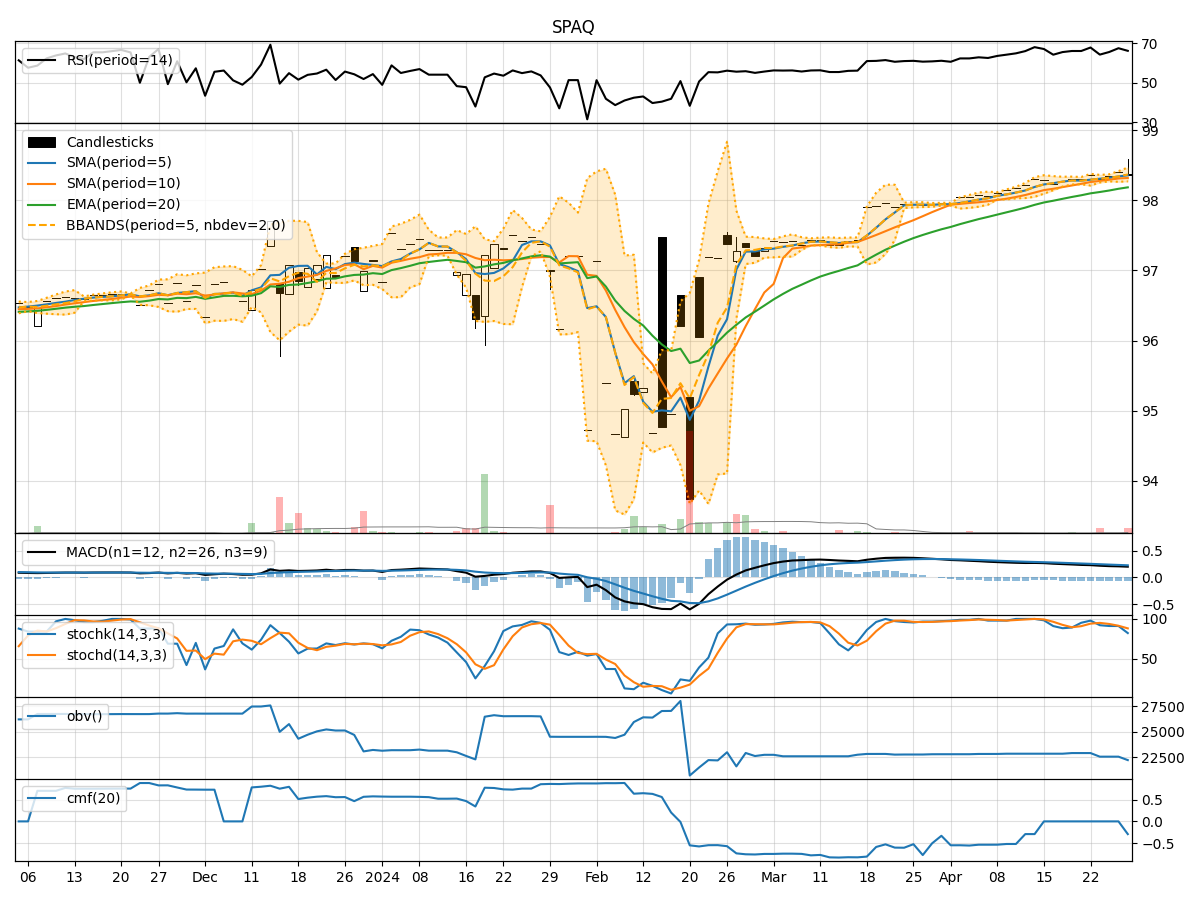
In analyzing the technical indicators for SPAQ over the last 5 days, we will delve into the trend, momentum, volatility, and volume indicators to provide a comprehensive outlook on the possible stock price movement in the coming days. By examining key metrics such as moving averages, MACD, RSI, Bollinger Bands, and OBV, we aim to offer valuable insights and predictions for potential price action.
Trend Indicators:
- Moving Averages (MA): The 5-day moving average has been steadily increasing, indicating a positive trend in the stock price.
- MACD: The MACD line has been consistently above the signal line, suggesting bullish momentum.
- EMA: The exponential moving average has also been on an upward trajectory, supporting the bullish sentiment.
Momentum Indicators:
- RSI: The Relative Strength Index has been in the overbought territory, signaling a strong bullish momentum.
- Stochastic Oscillator: Both %K and %D have been relatively high, indicating an overbought condition.
- Williams %R: The Williams %R is in the oversold region, suggesting a potential reversal in the short term.
Volatility Indicators:
- Bollinger Bands: The stock price has been trading within the upper Bollinger Band, indicating an increased volatility and potential overbought conditions.
- Bollinger Band Width: The band width has been narrowing, which could signal a period of consolidation or a potential breakout.
Volume Indicators:
- On-Balance Volume (OBV): The OBV has been relatively stable, indicating a balance between buying and selling pressure.
- Chaikin Money Flow (CMF): The CMF has been negative, suggesting a lack of buying interest in the stock.
Key Observations:
- The stock is currently exhibiting strong bullish momentum based on the RSI and MACD indicators.
- The Bollinger Bands suggest that the stock is in an overbought condition, which could lead to a potential pullback or consolidation.
- The volume indicators show a lack of significant buying interest, which could limit the upside potential in the short term.
Conclusion:
Based on the analysis of the technical indicators, the stock is likely to experience a short-term pullback or consolidation due to the overbought conditions indicated by the RSI and Bollinger Bands. Traders should exercise caution and consider taking profits or implementing risk management strategies in anticipation of a potential downward movement. However, the overall trend remains bullish, so any pullback could present a buying opportunity for long-term investors.