Technical Analysis of SPAX 2024-05-10
Overview:
In analyzing the technical indicators for SPAX over the last 5 days, we will delve into the trend, momentum, volatility, and volume indicators to provide insights into the possible future stock price movements. By examining these indicators, we aim to offer a comprehensive analysis and make informed predictions for the upcoming days.
Trend Indicators:
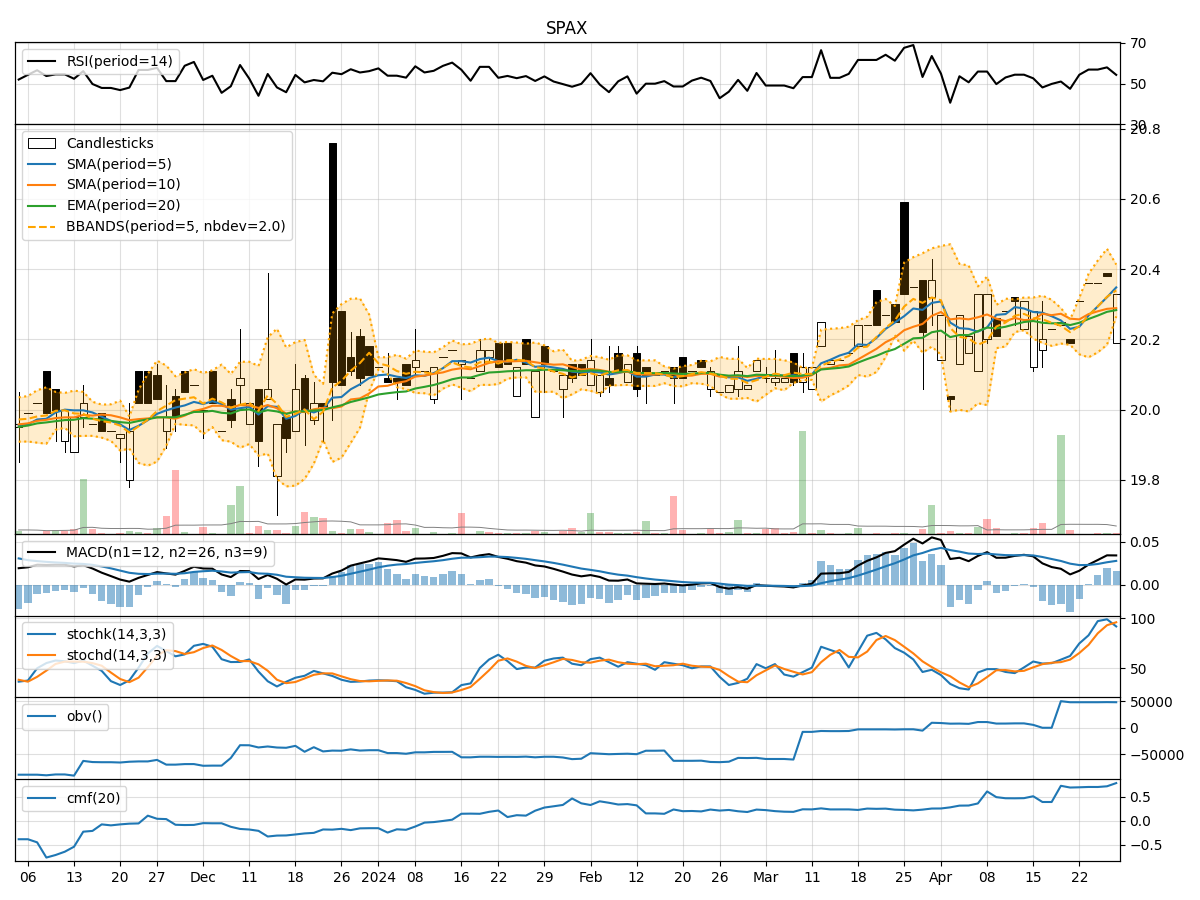
- Moving Averages (MA): The 5-day Moving Average (MA) has been showing an upward trend, indicating a positive momentum in the stock price.
- MACD: The Moving Average Convergence Divergence (MACD) has been consistently positive, suggesting bullish momentum in the stock.
- EMA: The Exponential Moving Average (EMA) has been trending upwards, further supporting the bullish sentiment in the stock.
Key Observation: The trend indicators point towards a bullish outlook for SPAX in the near term.
Momentum Indicators:
- RSI: The Relative Strength Index (RSI) has been hovering around the neutral zone, indicating a balanced momentum in the stock.
- Stochastic Oscillator: Both %K and %D values have been in the overbought territory, suggesting a potential reversal or consolidation.
- Williams %R: The Williams %R is also in the overbought region, signaling a possible pullback in the stock price.
Key Observation: The momentum indicators suggest a potential consolidation or pullback in the stock price.
Volatility Indicators:
- Bollinger Bands: The Bollinger Bands are showing a narrowing of the bands, indicating decreasing volatility in the stock.
- Bollinger %B: The %B value is below 1, suggesting that the stock is trading below the upper band, potentially indicating a buying opportunity.
Key Observation: The volatility indicators imply a reduction in volatility and a possible buying opportunity in SPAX.
Volume Indicators:
- On-Balance Volume (OBV): The OBV has been relatively stable, indicating a balance between buying and selling pressure.
- Chaikin Money Flow (CMF): The CMF has been positive, suggesting inflows into the stock over the past 20 days.
Key Observation: The volume indicators reflect a neutral sentiment with a slight positive bias towards the stock.
Conclusion:
Based on the analysis of the technical indicators, the overall outlook for SPAX in the next few days is as follows: - Trend: Upward trend - Momentum: Consolidation or pullback expected - Volatility: Decreasing volatility with a potential buying opportunity - Volume: Neutral sentiment with a slight positive bias
Therefore, considering the mixed signals from the momentum indicators and the potential for consolidation, investors should exercise caution. However, the overall bullish trend and decreasing volatility may present opportunities for strategic entry points. It is advisable to monitor the stock closely for any signs of a reversal or continuation of the current trend.