Technical Analysis of SPBC 2024-05-10
Overview:
In analyzing the technical indicators for SPBC over the last 5 days, we will delve into the trend, momentum, volatility, and volume indicators to provide a comprehensive outlook on the possible stock price movement in the coming days.
Trend Analysis:
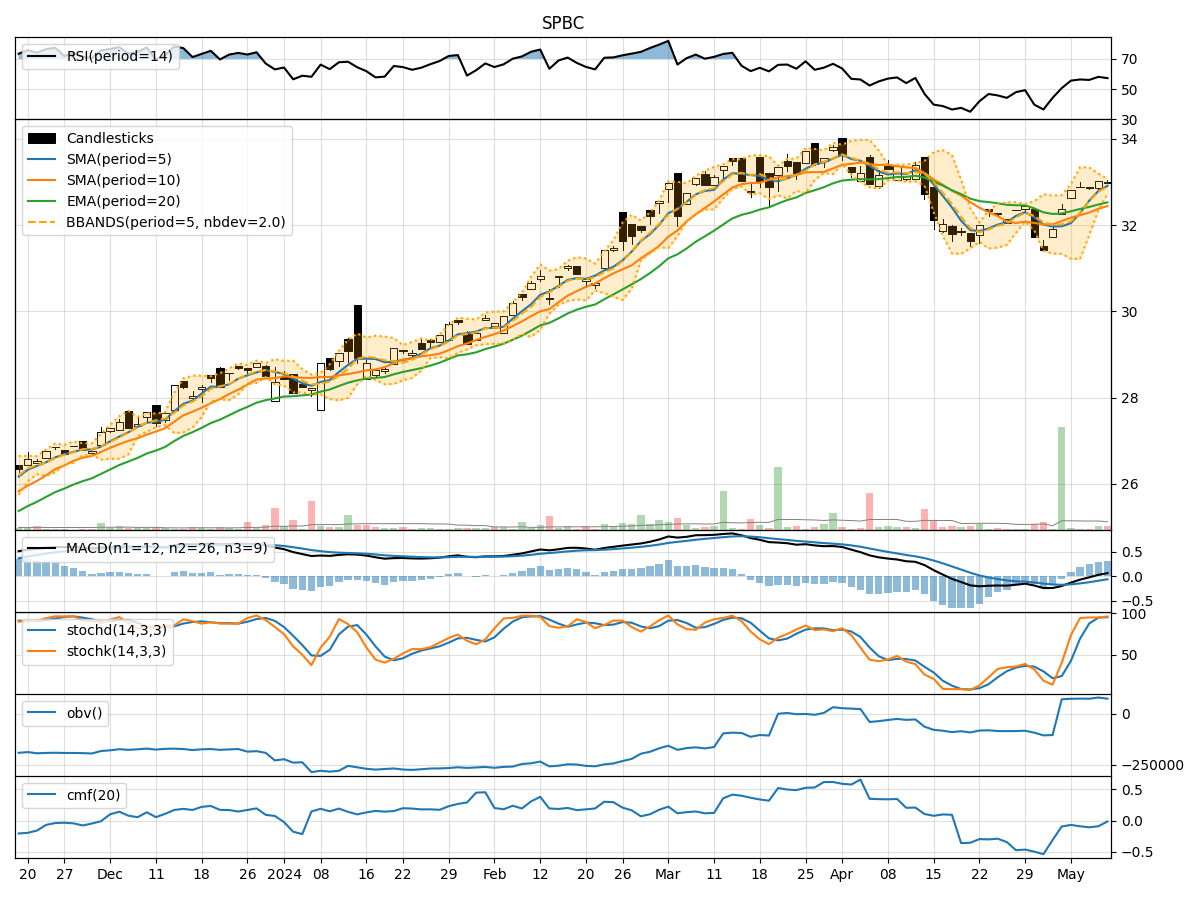
- Moving Averages (MA): The 5-day Moving Average (MA) has been consistently above the Simple Moving Average (SMA) and Exponential Moving Average (EMA), indicating a short-term bullish trend.
- MACD: The MACD line has been consistently above the signal line, with the MACD histogram showing an increasing positive trend, suggesting bullish momentum.
Momentum Analysis:
- RSI: The Relative Strength Index (RSI) has been fluctuating around the 50 level, indicating a neutral momentum in the stock.
- Stochastic Oscillator: Both %K and %D have been in the overbought zone, suggesting a potential reversal or consolidation in the near term.
Volatility Analysis:
- Bollinger Bands (BB): The stock price has been trading within the Bollinger Bands, with the bands narrowing, indicating decreasing volatility.
- Bollinger %B: The %B indicator has been hovering around 0.7, suggesting the stock is trading closer to the upper band.
Volume Analysis:
- On-Balance Volume (OBV): The OBV indicator has been relatively flat, indicating a balance between buying and selling pressure.
- Chaikin Money Flow (CMF): The CMF has been negative, indicating a lack of strong buying interest in the stock.
Conclusion:
Based on the analysis of the technical indicators, the stock of SPBC is likely to experience sideways movement in the coming days. The trend indicators suggest a short-term bullish bias, supported by the MACD and moving averages. However, the momentum indicators show a neutral stance with potential signs of overbought conditions. The volatility is decreasing, indicating a possible period of consolidation, while the volume indicators point to a lack of significant buying interest.
Therefore, it is recommended to exercise caution and closely monitor the stock for any signs of a breakout or reversal in the current sideways trend. Traders may consider implementing range-bound strategies until a clearer trend direction emerges.