Technical Analysis of SPCX 2024-05-10
Overview:
In analyzing the technical indicators for SPCX over the last 5 days, we will delve into the trend, momentum, volatility, and volume indicators to provide a comprehensive outlook on the possible stock price movement. By examining these key factors, we aim to offer valuable insights and predictions for the upcoming days.
Trend Indicators:
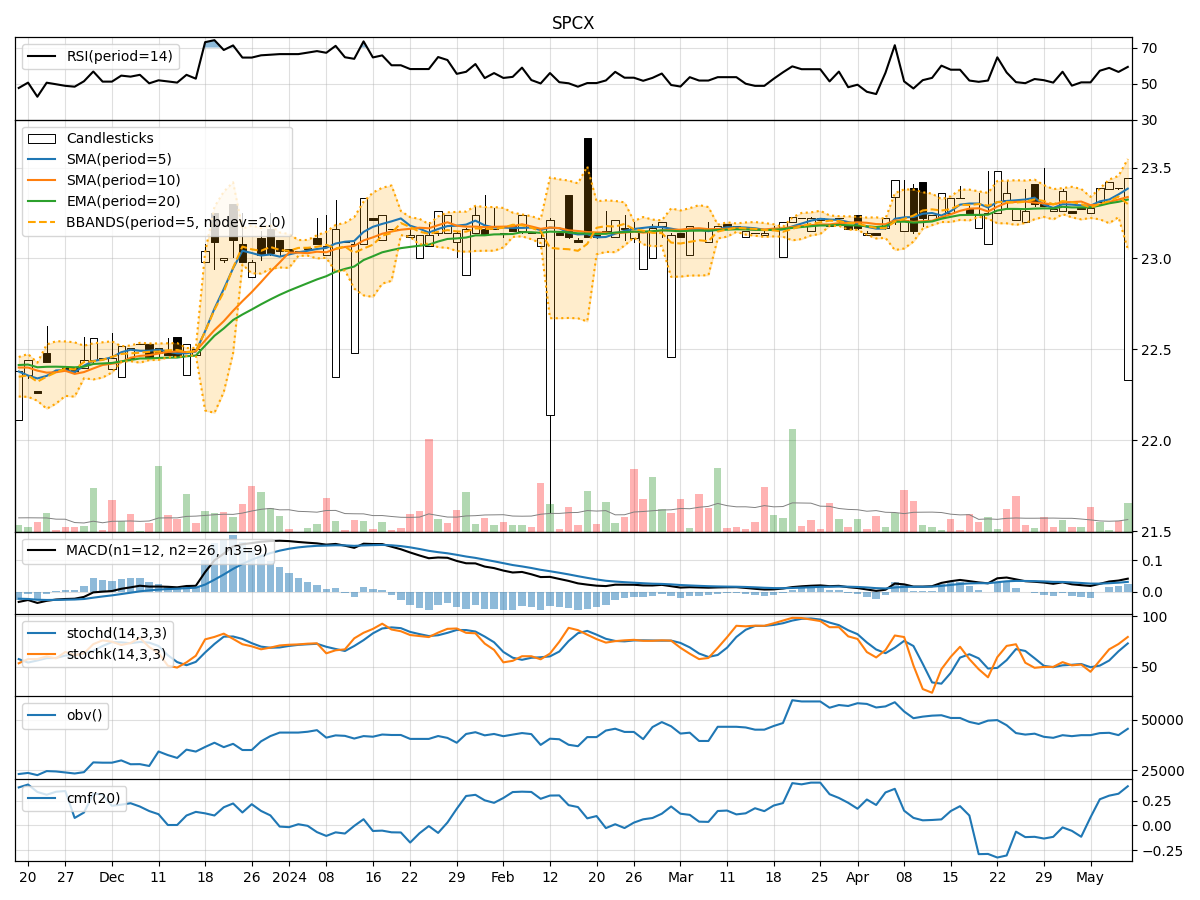
- Moving Averages (MA): The 5-day MA has been showing a slight uptrend, indicating a positive momentum in the short term.
- MACD: The MACD line has been consistently above the signal line, suggesting a bullish trend.
- EMA: The EMA has been steadily increasing, supporting the bullish sentiment in the market.
Key Observation: The trend indicators point towards an upward movement in the stock price.
Momentum Indicators:
- RSI: The RSI has been fluctuating around the 50 level, indicating a neutral momentum in the market.
- Stochastic Oscillator: Both %K and %D have been in the overbought territory, signaling a potential reversal in the short term.
- Williams %R: The Williams %R is hovering near the oversold region, suggesting a possible buying opportunity.
Key Observation: The momentum indicators suggest a sideways movement with a potential for a short-term correction.
Volatility Indicators:
- Bollinger Bands: The stock price has been trading within the upper Bollinger Band, indicating an overbought condition.
- Bollinger %B: The %B value is above 0.8, signaling a potential reversal or consolidation phase.
Key Observation: The volatility indicators imply a potential pullback or consolidation in the stock price.
Volume Indicators:
- On-Balance Volume (OBV): The OBV has been fluctuating, indicating indecision among investors.
- Chaikin Money Flow (CMF): The CMF has been gradually increasing, suggesting a positive inflow of money into the stock.
Key Observation: The volume indicators reflect a mixed sentiment among market participants.
Conclusion:
Based on the analysis of the technical indicators, the next few days may see a sideways movement in the stock price with a potential for a short-term correction. While the trend indicators point towards an upward bias, the momentum and volatility indicators suggest a possible pullback or consolidation. Investors should closely monitor the price action and key support/resistance levels for better decision-making.
Recommendation:
- Short-term Traders: Consider booking profits on existing positions and wait for a clearer trend confirmation.
- Long-term Investors: Hold onto positions with a cautious approach, considering potential market corrections.
Always remember to conduct further research and consider fundamental factors before making any investment decisions.