Technical Analysis of SPCZ 2024-05-10
Overview:
In analyzing the technical indicators for SPCZ over the last 5 days, we will delve into the trend, momentum, volatility, and volume indicators to provide a comprehensive outlook on the possible stock price movement in the coming days. By examining key metrics such as moving averages, MACD, RSI, Bollinger Bands, and OBV, we aim to offer valuable insights and recommendations for potential trading strategies.
Trend Indicators:
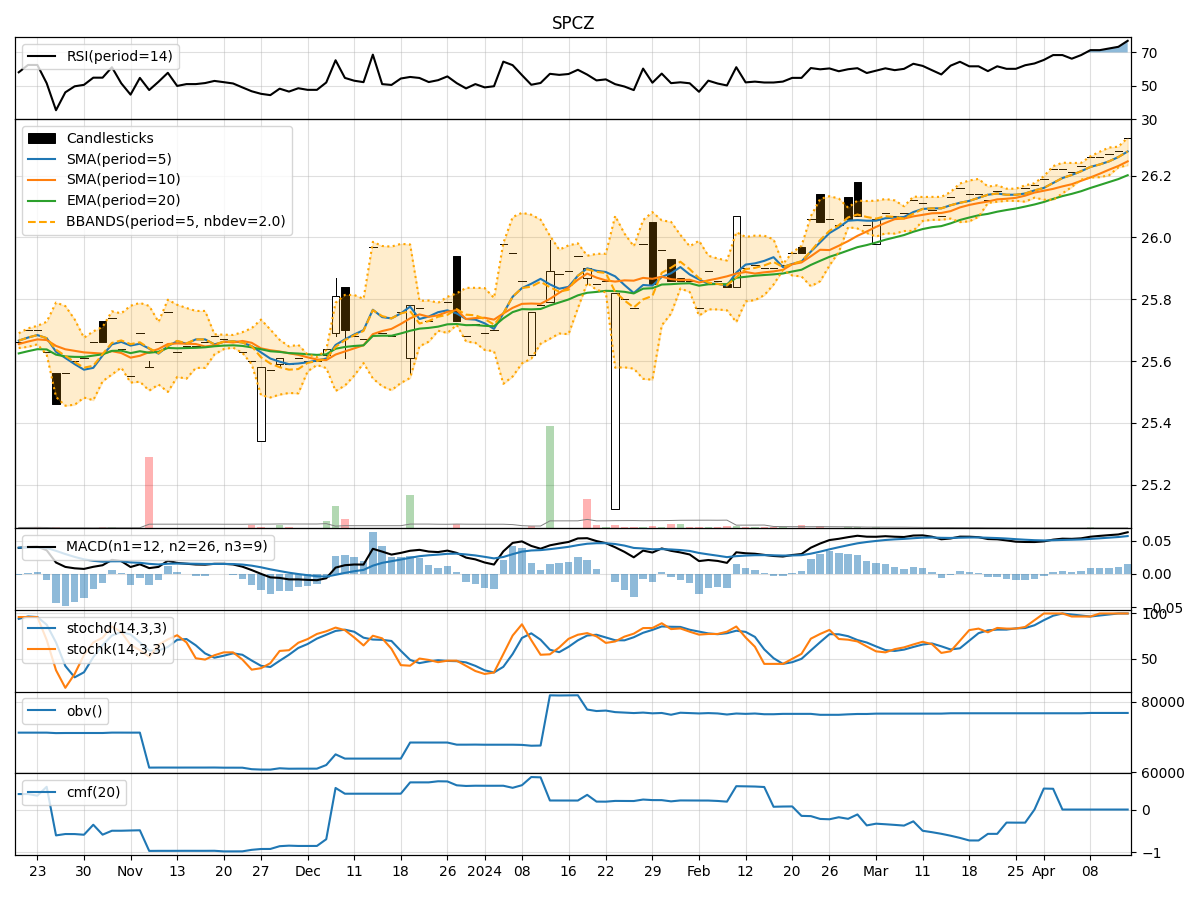
- Moving Averages (MA): The 5-day MA has been relatively stable around the current stock price, indicating a neutral trend.
- MACD: The MACD line has been positive, suggesting a bullish momentum in the short term.
- MACD Histogram: The MACD histogram has been decreasing, signaling a potential slowdown in the bullish momentum.
Momentum Indicators:
- RSI: The RSI has been fluctuating around the 50 level, indicating a lack of strong momentum in either direction.
- Stochastic Oscillator: Both %K and %D have been declining, pointing towards a potential bearish momentum shift.
- Williams %R: The Williams %R is in oversold territory, suggesting a possible reversal to the upside.
Volatility Indicators:
- Bollinger Bands: The Bollinger Bands have been narrowing, indicating decreasing volatility and a potential period of consolidation.
- Bollinger Band %B: The %B indicator is hovering around the middle, reflecting a balanced market sentiment.
- Bollinger Band Width: The Band Width has been contracting, signaling a decrease in price volatility.
Volume Indicators:
- On-Balance Volume (OBV): The OBV has remained constant, suggesting a lack of significant buying or selling pressure.
- Chaikin Money Flow (CMF): The CMF has been positive, indicating a potential inflow of money into the stock.
Conclusion:
Based on the analysis of the technical indicators, the stock of SPCZ is likely to experience sideways movement in the next few days. The lack of strong trends in the moving averages, mixed signals from momentum indicators, decreasing volatility, and stable volume suggest a period of consolidation. Traders may consider adopting a neutral stance or employing range-bound strategies until clearer signals emerge in the technical indicators.