Technical Analysis of SPDG 2024-05-10
Overview:
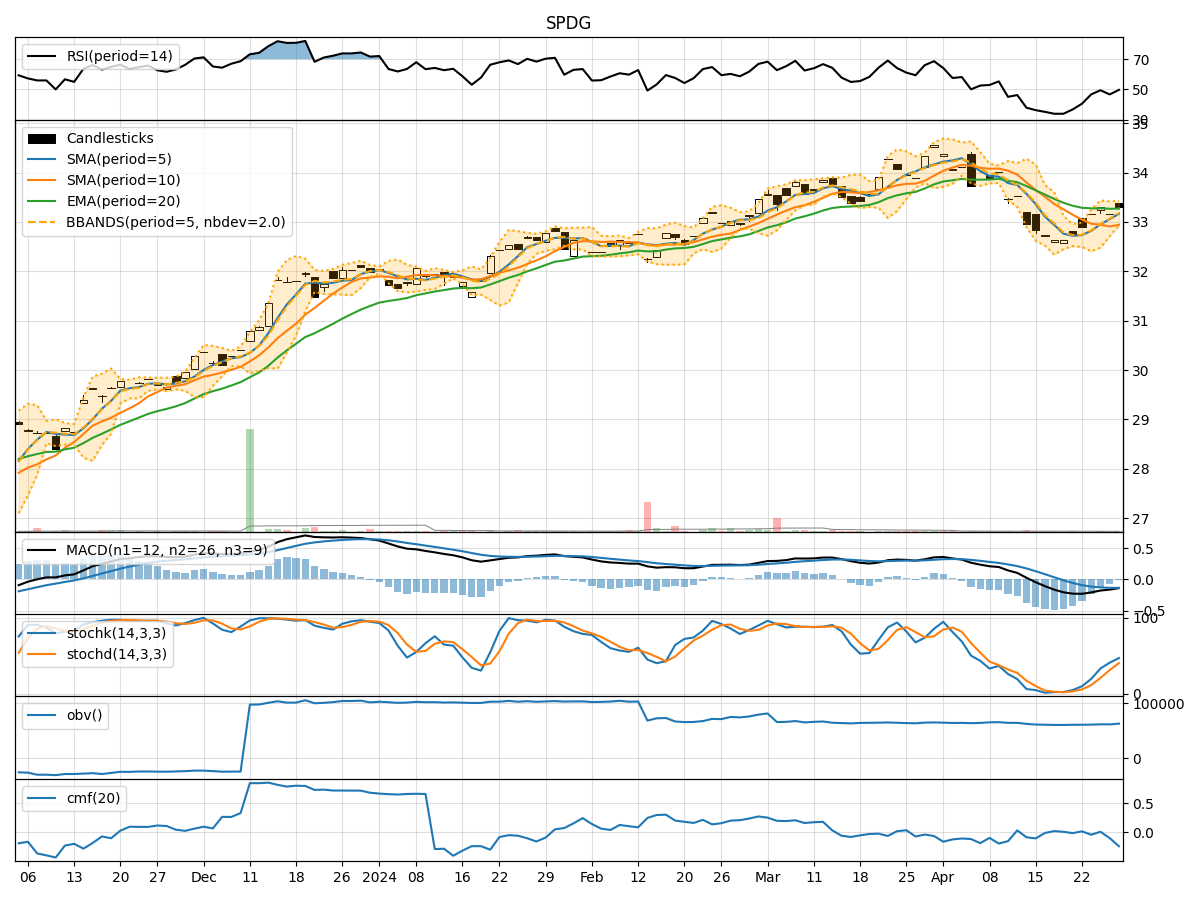
In analyzing the technical indicators for SPDG over the last 5 days, we will delve into the trend, momentum, volatility, and volume indicators to provide a comprehensive outlook on the possible stock price movement in the coming days.
Trend Indicators:
- Moving Averages (MA): The 5-day MA has been trending above the closing prices, indicating a short-term bullish trend.
- MACD: The MACD line has been consistently above the signal line, suggesting bullish momentum.
- EMA: The Exponential Moving Average has been steadily increasing, supporting the bullish trend.
Momentum Indicators:
- RSI: The Relative Strength Index has been gradually increasing, indicating strengthening bullish momentum.
- Stochastic Oscillator: Both %K and %D have been in the overbought zone, signaling a strong bullish sentiment.
- Williams %R: The indicator has consistently been at 0, reflecting a strong bullish sentiment.
Volatility Indicators:
- Bollinger Bands: The bands have been widening, suggesting increased volatility in the stock price.
- Bollinger %B: The %B indicator has been fluctuating within a range, indicating potential price reversals.
Volume Indicators:
- On-Balance Volume (OBV): The OBV has been showing a slight decrease, which may indicate some distribution happening in the stock.
- Chaikin Money Flow (CMF): The CMF has been positive, indicating buying pressure in the stock.
Key Observations and Opinions:
- Trend: The stock is in a clear upward trend supported by moving averages and MACD.
- Momentum: Momentum indicators like RSI and Stochastic Oscillator suggest a strong bullish sentiment in the market.
- Volatility: Bollinger Bands widening indicate increased volatility, which could lead to larger price swings.
- Volume: While OBV shows a slight decrease, the CMF indicates positive buying pressure in the stock.
Conclusion:
Based on the analysis of the technical indicators, the next few days for SPDG are likely to see continued upward movement in the stock price. The strong bullish sentiment indicated by momentum indicators, coupled with the positive trend and buying pressure, suggest that the stock is poised for further gains. Traders and investors may consider buying opportunities in SPDG for potential short to medium-term profits.