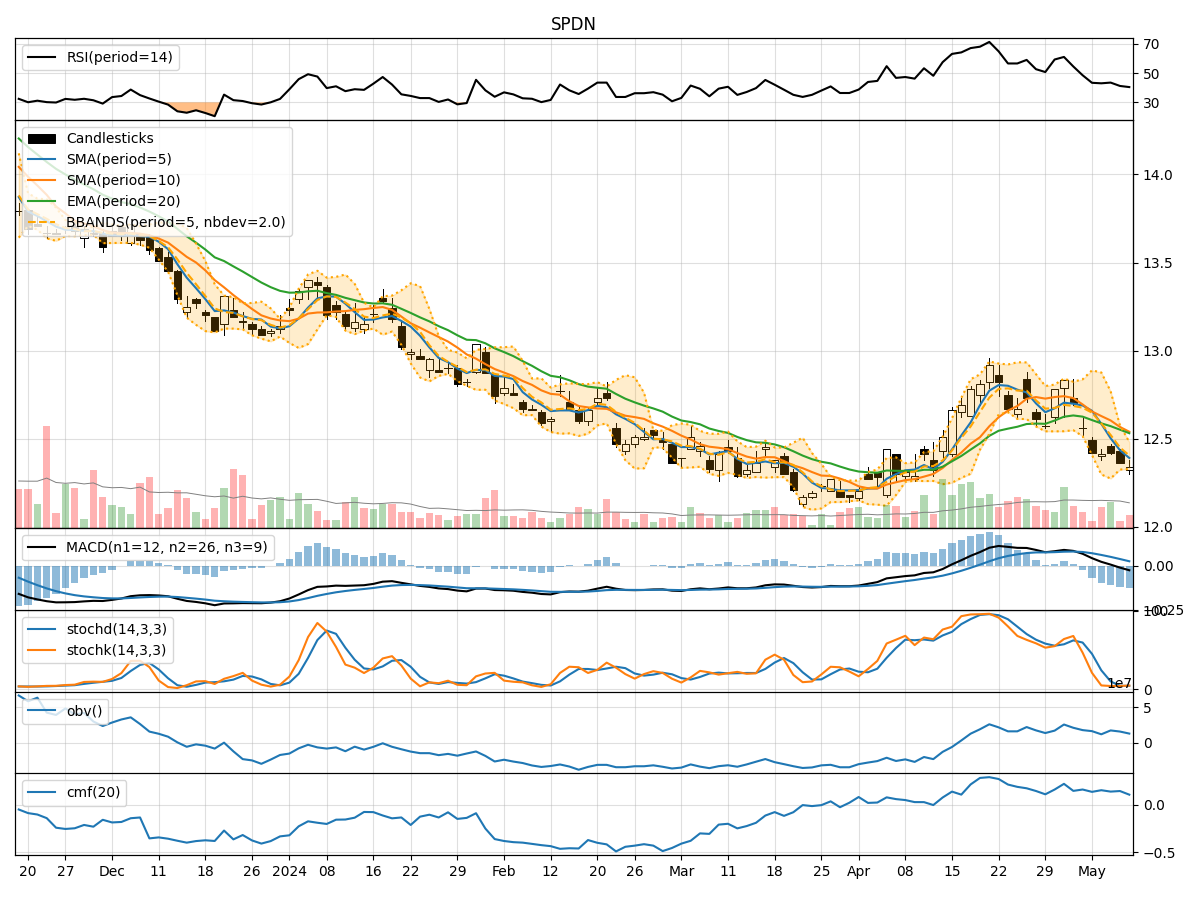
Technical Analysis of SPDN 2024-05-10
Overview:
In analyzing the technical indicators for SPDN over the last 5 days, we will delve into the trend, momentum, volatility, and volume indicators to provide a comprehensive outlook on the possible stock price movement in the coming days. By examining these key indicators, we aim to offer valuable insights and recommendations for potential investors.
Trend Analysis:
- Moving Averages (MA): The 5-day MA has been consistently decreasing, indicating a downward trend in the stock price.
- MACD: The MACD line has been negative, suggesting a bearish momentum in the stock.
- EMA: The EMA has also been declining, further supporting the bearish trend.
Momentum Analysis:
- RSI: The RSI has been relatively low, indicating potential oversold conditions in the stock.
- Stochastic Oscillator: Both %K and %D have been at very low levels, signaling a potential reversal or bounce in the stock price.
- Williams %R: The indicator has been in the oversold territory, suggesting a possible upward movement.
Volatility Analysis:
- Bollinger Bands (BB): The stock price has been trading below the lower Bollinger Band, indicating oversold conditions.
- Bollinger Band Width (BBW): The BBW has been narrowing, suggesting a potential decrease in volatility.
- Bollinger Band %B (BBP): The %B has been increasing, indicating a possible reversal in the stock price.
Volume Analysis:
- On-Balance Volume (OBV): The OBV has been relatively stable, indicating a neutral volume flow in the stock.
- Chaikin Money Flow (CMF): The CMF has been positive, suggesting buying pressure in the stock.
Key Observations and Opinions:
- Trend: The stock is currently in a downtrend based on the moving averages and MACD.
- Momentum: The momentum indicators suggest a potential reversal in the stock price due to oversold conditions.
- Volatility: The narrowing Bollinger Bands and increasing %B indicate a possible reversal in the stock price.
- Volume: The volume indicators show neutral volume flow with a slight buying pressure.
Conclusion:
Based on the analysis of the technical indicators, it is likely that the stock price of SPDN may experience a short-term reversal or bounce in the coming days. Investors should closely monitor the momentum indicators for confirmation of a potential upward movement. However, it is essential to consider other fundamental factors and market dynamics before making any investment decisions.