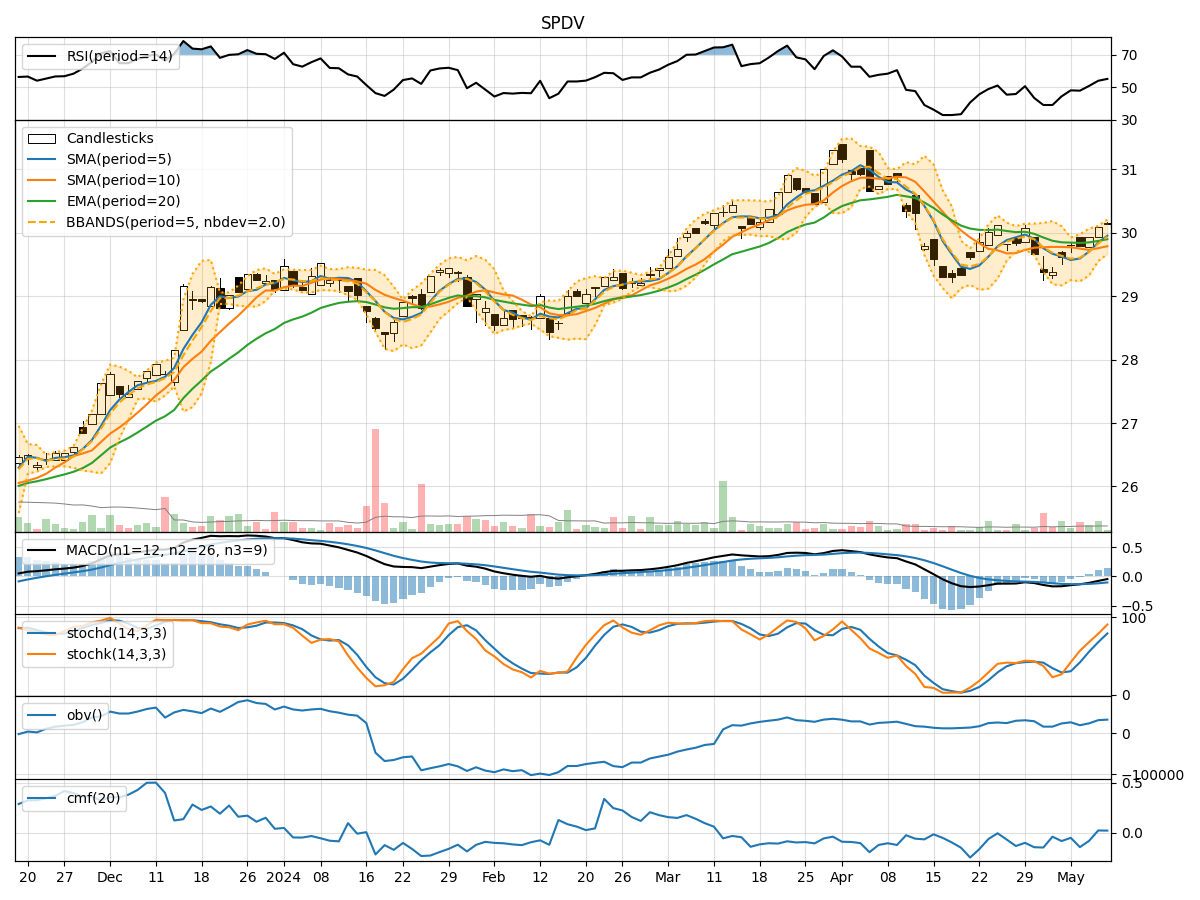
Technical Analysis of SPDV 2024-05-10
Overview:
In analyzing the technical indicators for SPDV over the last 5 days, we will delve into the trend, momentum, volatility, and volume indicators to provide a comprehensive outlook on the possible stock price movement in the coming days. By examining these key aspects, we aim to offer valuable insights and predictions to guide your investment decisions.
Trend Indicators:
- Moving Averages (MA): The 5-day MA has been trending slightly above the closing prices, indicating a short-term uptrend.
- MACD: The MACD line has been below the signal line, suggesting a bearish momentum.
- MACD Histogram: The histogram has been decreasing, signaling a weakening bearish momentum.
Momentum Indicators:
- RSI: The RSI has been gradually increasing, indicating strengthening bullish momentum.
- Stochastic Oscillator: Both %K and %D have been rising, reflecting increasing buying pressure.
- Williams %R: The indicator has been moving towards oversold territory, suggesting a potential reversal to the upside.
Volatility Indicators:
- Bollinger Bands (BB): The stock price has been trading within the bands, indicating normal volatility.
- Bollinger Band Width: The band width has been relatively stable, suggesting consistent volatility levels.
Volume Indicators:
- On-Balance Volume (OBV): The OBV has been increasing, indicating accumulation by investors.
- Chaikin Money Flow (CMF): The CMF has been negative but improving, signaling a potential shift towards buying pressure.
Key Observations and Opinions:
- Trend: The short-term trend is slightly bullish based on the MA, but the MACD indicates a weakening momentum.
- Momentum: Momentum indicators like RSI and Stochastic Oscillator suggest a strengthening bullish sentiment.
- Volatility: Volatility has been relatively stable, indicating a lack of significant price fluctuations.
- Volume: Accumulation is evident from the increasing OBV, while the CMF shows a potential shift towards buying pressure.
Conclusion:
Based on the analysis of the technical indicators, the next few days for SPDV could see upward movement in stock prices. The bullish momentum indicated by RSI and Stochastic Oscillator, coupled with the accumulation shown by OBV, suggests a positive outlook. However, caution is advised due to the weakening trend indicated by the MACD. Overall, the stock is likely to experience a bullish bias in the near term.