Technical Analysis of SPDW 2024-05-10
Overview:
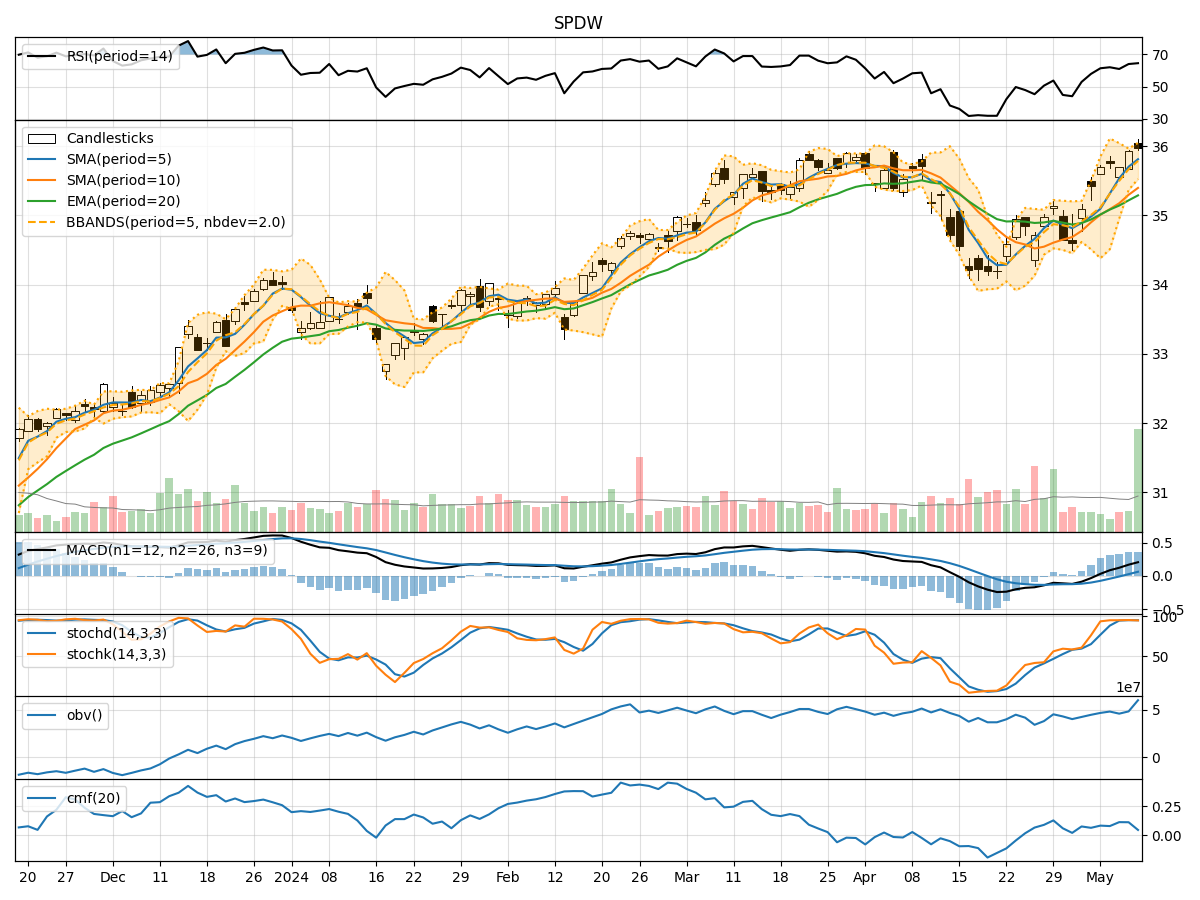
In analyzing the technical indicators for SPDW over the last 5 days, we will delve into the trend, momentum, volatility, and volume indicators to provide a comprehensive outlook on the possible stock price movement in the coming days.
Trend Analysis:
- Moving Averages (MA): The 5-day Moving Average has been consistently above the closing prices, indicating a bullish trend.
- MACD: The MACD line has been consistently above the signal line, suggesting a bullish momentum.
- Relative Strength Index (RSI): RSI has been in the range of 60-70, indicating a neutral to slightly bullish sentiment.
Momentum Analysis:
- Stochastic Oscillator: Both %K and %D have been in the overbought zone, suggesting a potential reversal or consolidation.
- Williams %R (WillR): Williams %R has been fluctuating around oversold levels, indicating a mixed sentiment.
Volatility Analysis:
- Bollinger Bands (BB): The stock price has mostly remained within the bands, with the %B indicator showing fluctuations around the midline.
- Average True Range (ATR): ATR values have been relatively stable, indicating consistent volatility levels.
Volume Analysis:
- On-Balance Volume (OBV): OBV has shown an overall increasing trend, indicating accumulation by investors.
- Chaikin Money Flow (CMF): CMF has been positive, suggesting buying pressure in the stock.
Key Observations:
- The trend indicators suggest a bullish bias with moving averages and MACD supporting upward momentum.
- Momentum indicators show signs of potential overbought conditions, hinting at a possible correction or consolidation.
- Volatility has been relatively stable, indicating a lack of significant price fluctuations.
- Volume indicators point towards accumulation and positive buying pressure in the stock.
Conclusion:
Based on the analysis of technical indicators, the stock is likely to experience a short-term consolidation or minor pullback due to overbought conditions indicated by the Stochastic Oscillator and potential profit-taking by traders. However, the overall trend remains bullish, supported by moving averages and MACD. Investors should monitor the price action closely for a potential entry point during the consolidation phase, with a long-term bullish view on the stock.