Technical Analysis of SPEU 2024-05-10
Overview:
In analyzing the technical indicators for SPEU over the last 5 days, we will delve into the trend, momentum, volatility, and volume indicators to provide a comprehensive outlook on the possible stock price movement. By examining these key aspects, we aim to offer valuable insights and predictions for the upcoming trading days.
Trend Indicators:
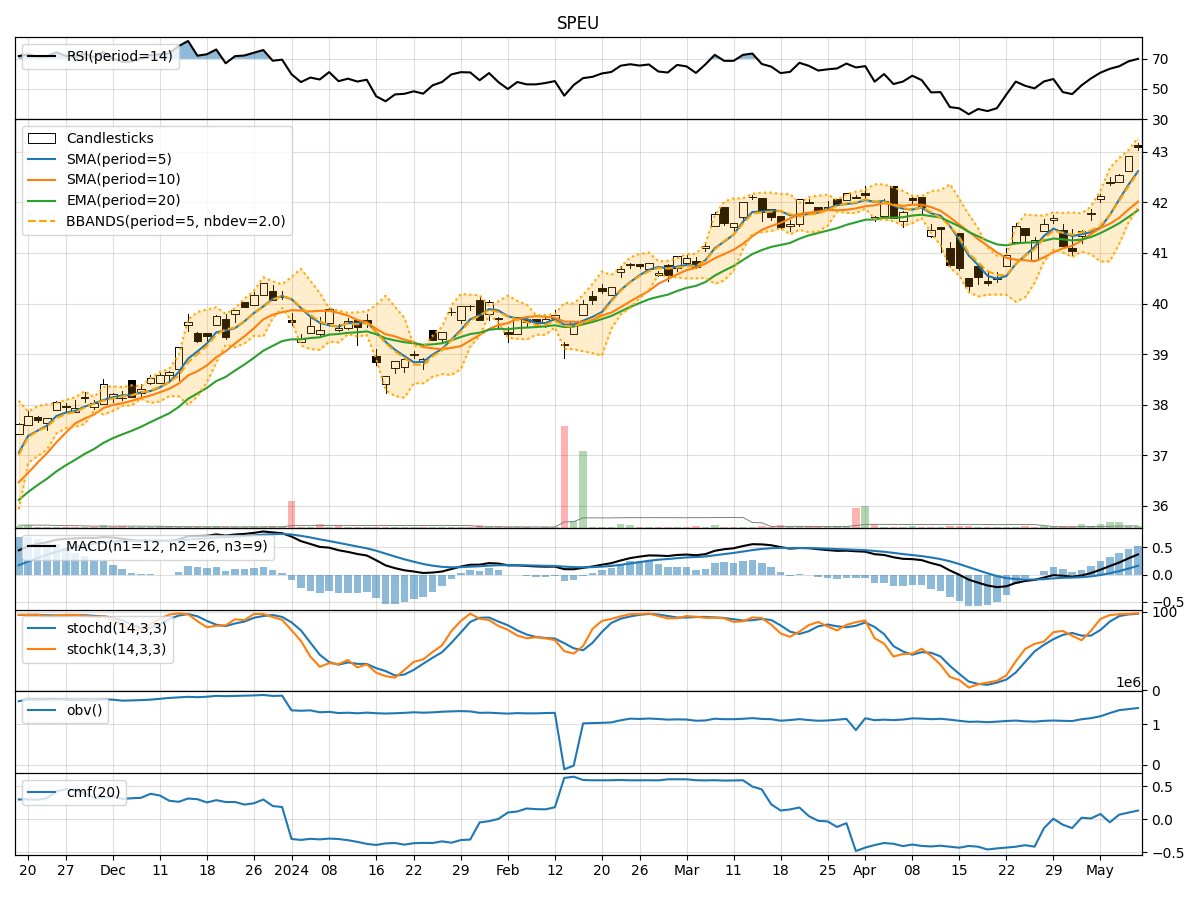
- Moving Averages (MA): The 5-day Moving Average has been consistently above the closing prices, indicating a bullish trend.
- MACD: The MACD line has been steadily increasing, with the MACD histogram also showing positive values, suggesting a strengthening bullish momentum.
- EMA: The Exponential Moving Average has been trending upwards, supporting the bullish sentiment in the short term.
Momentum Indicators:
- RSI: The Relative Strength Index has been in the overbought territory, indicating a strong bullish momentum.
- Stochastic Oscillator: Both %K and %D have been in the overbought zone, signaling a potential reversal or consolidation.
- Williams %R: The indicator has been in the oversold region, suggesting a possible pullback in the near future.
Volatility Indicators:
- Bollinger Bands: The bands have been widening, indicating increased volatility in the stock price.
- Bollinger %B: The %B indicator has been fluctuating within a range, suggesting potential price reversals or breakouts.
Volume Indicators:
- On-Balance Volume (OBV): The OBV has shown mixed signals, with some days seeing accumulation and others distribution.
- Chaikin Money Flow (CMF): The CMF has been positive, indicating buying pressure in the stock.
Key Observations:
- The trend indicators suggest a strong bullish sentiment in the short term.
- Momentum indicators show overbought conditions, hinting at a possible correction or consolidation.
- Volatility indicators point towards increased price fluctuations.
- Volume indicators reflect mixed signals, with some accumulation and buying pressure.
Conclusion:
Based on the analysis of the technical indicators, the next few days for SPEU could see further upward movement in the stock price, supported by the bullish trend and momentum. However, caution is advised due to the overbought conditions and increased volatility, which may lead to a potential correction or consolidation in the near future. Traders should closely monitor key levels and wait for confirmation signals before making any significant trading decisions.