Technical Analysis of SPFF 2024-05-10
Overview:
In analyzing the technical indicators for SPFF over the last 5 days, we will delve into the trend, momentum, volatility, and volume indicators to provide a comprehensive outlook on the possible stock price movement in the coming days. By examining these key aspects, we aim to offer valuable insights and predictions to guide your investment decisions.
Trend Analysis:
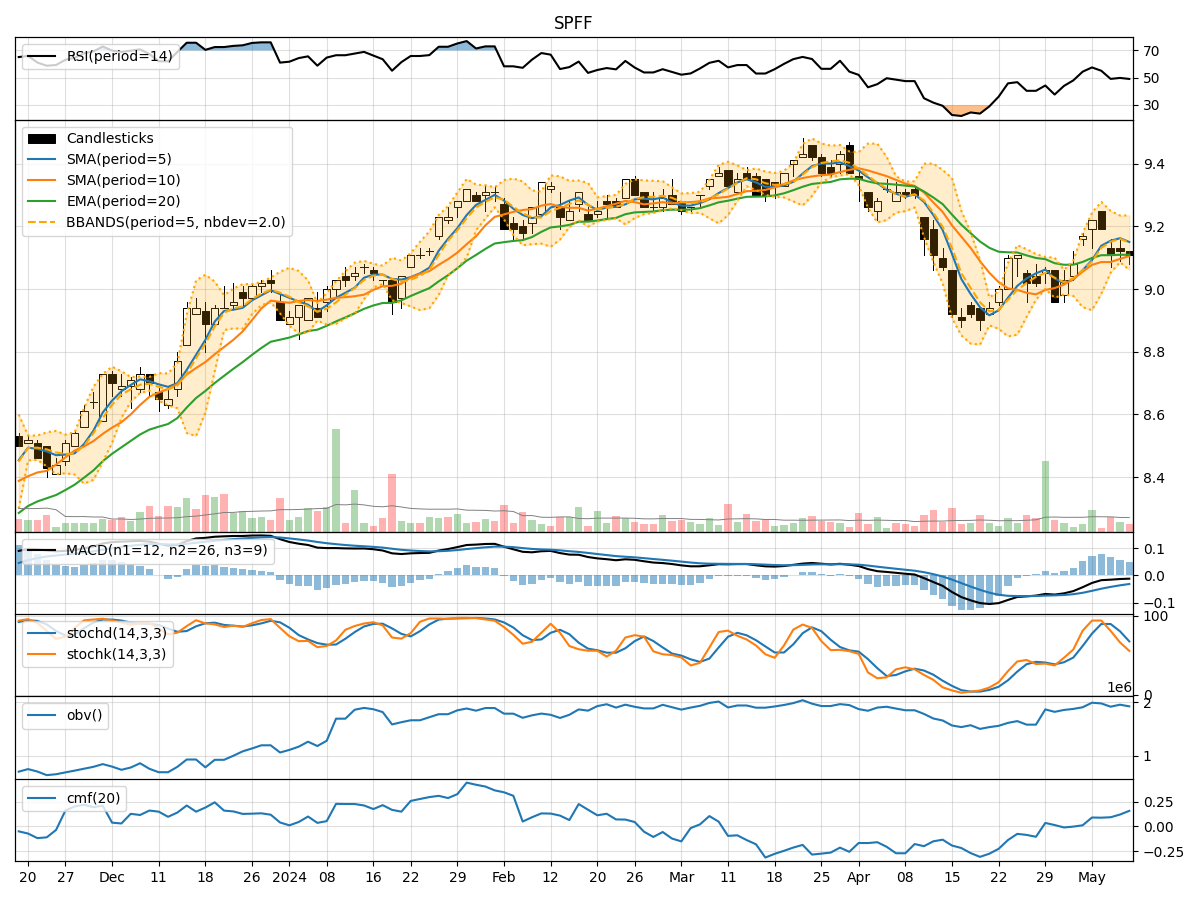
- Moving Averages (MA): The 5-day Moving Average (MA) has been relatively stable around the current price, indicating a neutral trend.
- MACD: The Moving Average Convergence Divergence (MACD) has been consistently negative, suggesting a bearish momentum in the short term.
- EMA: The Exponential Moving Average (EMA) has shown a slight downward trend, reflecting a potential bearish sentiment in the market.
Momentum Analysis:
- RSI: The Relative Strength Index (RSI) has been hovering around the neutral zone, indicating a lack of strong momentum either bullish or bearish.
- Stochastic Oscillator: Both %K and %D of the Stochastic Oscillator have been declining, signaling a weakening momentum in the stock.
- Williams %R: The Williams %R is in the oversold territory, suggesting a possible reversal or consolidation phase.
Volatility Analysis:
- Bollinger Bands: The Bollinger Bands have been narrowing, indicating decreasing volatility and a potential period of consolidation.
- Bollinger %B: The %B indicator is close to 0.5, suggesting the stock is trading around the middle band, reinforcing the consolidation outlook.
Volume Analysis:
- On-Balance Volume (OBV): The OBV has shown mixed signals with fluctuations in volume, indicating indecision among market participants.
- Chaikin Money Flow (CMF): The CMF has been positive, suggesting some buying pressure in the stock.
Conclusion:
Based on the analysis of the technical indicators, the stock is likely to experience sideways movement or consolidation in the coming days. The bearish signals from the MACD and EMA, coupled with the weakening momentum indicated by the Stochastic Oscillator, suggest a potential downside risk. However, the oversold condition highlighted by the Williams %R and the positive CMF could lead to a temporary bounce or stabilization in the stock price.
Recommendation:
- Short-term Traders: Consider staying on the sidelines or adopting a cautious approach until a clear trend emerges.
- Long-term Investors: Monitor the price action closely and look for potential entry points during consolidation phases.
Always remember to conduct further research and consider fundamental factors before making any investment decisions. Market dynamics can change rapidly, so staying informed and adaptable is key to successful trading.