Technical Analysis of SPGM 2024-05-10
Overview:
In analyzing the technical indicators for SPGM over the last 5 days, we will delve into the trend, momentum, volatility, and volume indicators to provide a comprehensive outlook on the possible stock price movement in the coming days. By examining these key indicators, we aim to offer valuable insights and predictions to guide investment decisions.
Trend Indicators:
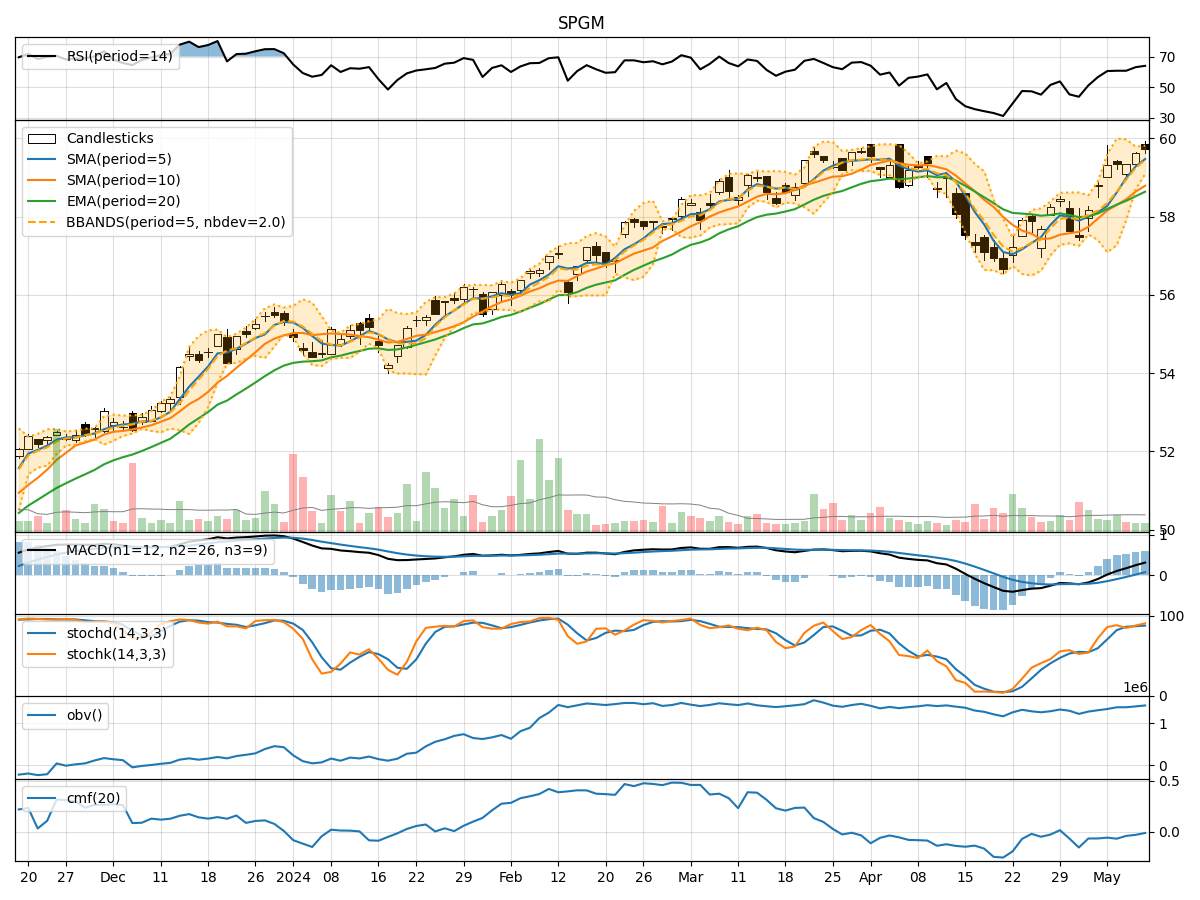
- Moving Averages (MA): The 5-day MA has been consistently above the longer-term SMAs and EMAs, indicating a bullish trend.
- MACD: The MACD line has been consistently above the signal line, suggesting positive momentum.
- MACD Histogram: The histogram has been increasing, indicating strengthening bullish momentum.
Momentum Indicators:
- RSI: The RSI has been in the overbought territory, indicating a strong bullish momentum.
- Stochastic Oscillator: Both %K and %D have been in the overbought zone, signaling a potential reversal.
- Williams %R: The indicator has been in the oversold region, suggesting a possible bullish reversal.
Volatility Indicators:
- Bollinger Bands: The price has been consistently trading above the middle band, indicating an uptrend.
- Bollinger %B: The %B indicator has been above 0.5, suggesting bullish momentum.
- Bollinger Band Width: The band width has been narrowing, indicating decreasing volatility.
Volume Indicators:
- On-Balance Volume (OBV): The OBV has been relatively flat, indicating a balance between buying and selling pressure.
- Chaikin Money Flow (CMF): The CMF has been negative, suggesting outflow of money from the stock.
Key Observations and Opinions:
- Trend: The trend indicators suggest a strong bullish sentiment in the stock.
- Momentum: Momentum indicators indicate a potential overbought condition, signaling a possible reversal.
- Volatility: Volatility has been decreasing, which could lead to a period of consolidation.
- Volume: Volume indicators show a lack of significant buying or selling pressure.
Conclusion:
Based on the analysis of the technical indicators, the stock price of SPGM is likely to experience a short-term consolidation or pullback in the coming days. The overbought conditions in momentum indicators and the lack of significant volume support suggest a potential slowdown in the bullish momentum. Traders may consider taking profits or waiting for a better entry point before considering long positions. Exercise caution and monitor the price action closely for any signs of a reversal or continuation of the current trend.