Technical Analysis of SPGP 2024-05-10
Overview:
In analyzing the technical indicators for SPGP over the last 5 days, we will delve into the trend, momentum, volatility, and volume indicators to provide a comprehensive outlook on the possible stock price movement. By examining these key aspects, we aim to offer valuable insights and predictions for the upcoming days.
Trend Analysis:
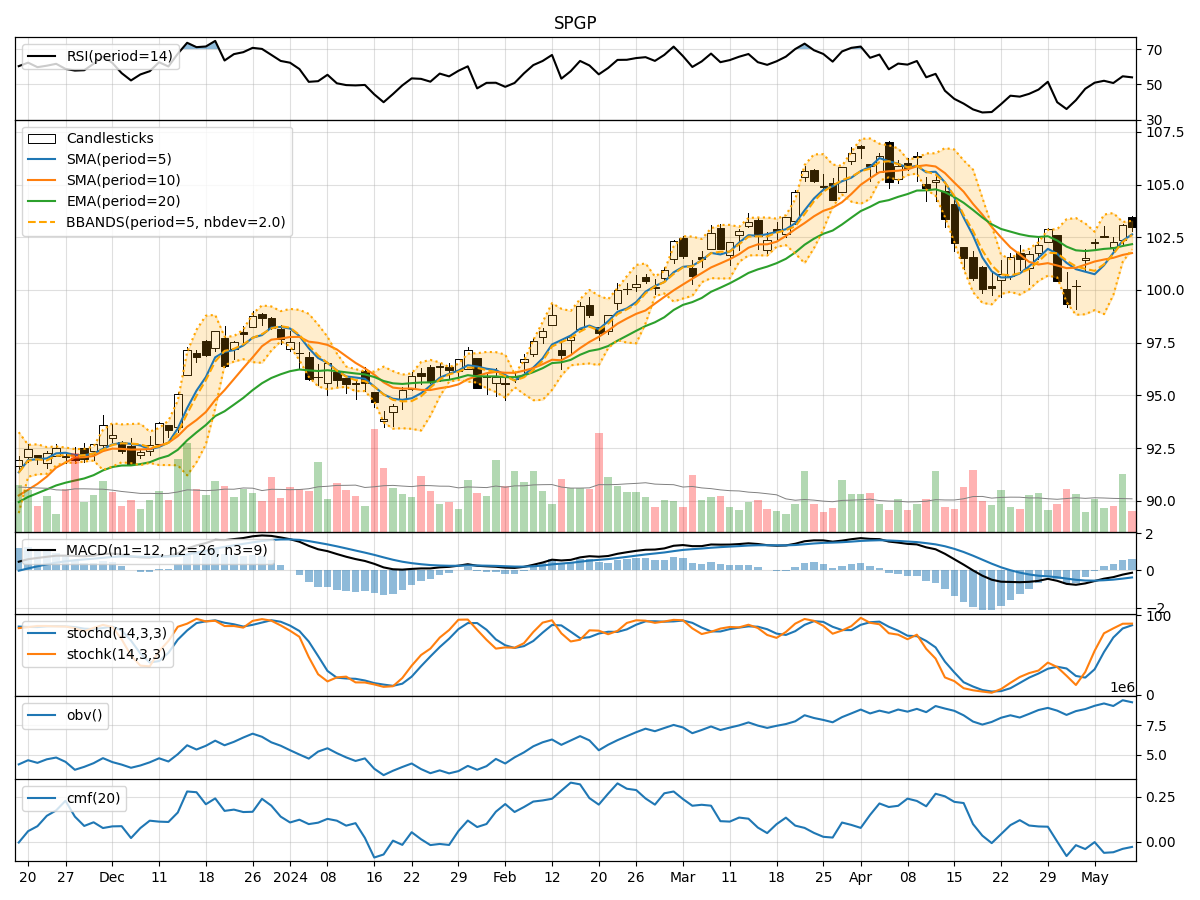
- Moving Averages (MA): The 5-day Moving Average (MA) has been consistently above the Simple Moving Average (SMA) and Exponential Moving Average (EMA), indicating a short-term bullish trend.
- MACD: The MACD line has been below the signal line but showing signs of convergence, suggesting a potential shift towards a bullish momentum.
Momentum Analysis:
- RSI: The Relative Strength Index (RSI) has been fluctuating around the neutral zone, indicating a lack of strong momentum in either direction.
- Stochastic Oscillator: Both %K and %D have been in the overbought territory, signaling a potential reversal or consolidation phase.
Volatility Analysis:
- Bollinger Bands (BB): The stock price has been trading within the Bollinger Bands, with the bands narrowing, indicating decreasing volatility.
- Bollinger %B: The %B indicator has been hovering around the middle range, suggesting a balanced market sentiment.
Volume Analysis:
- On-Balance Volume (OBV): The OBV has shown mixed movements, reflecting indecision among market participants.
- Chaikin Money Flow (CMF): The CMF has been negative, indicating selling pressure in the market.
Key Observations:
- The trend indicators suggest a potential bullish bias in the short term.
- Momentum indicators show a lack of strong momentum, indicating a possible consolidation phase.
- Volatility indicators point towards decreasing volatility and a potential period of price stabilization.
- Volume indicators reflect mixed signals, with selling pressure evident in the market.
Conclusion:
Based on the analysis of the technical indicators, the stock price of SPGP is likely to experience sideways movement or consolidation in the next few days. The bullish trend indicated by moving averages and MACD convergence may be offset by the lack of strong momentum and selling pressure reflected in the volume indicators. Traders should exercise caution and closely monitor key support and resistance levels for potential breakout opportunities.