Technical Analysis of SPHY 2024-05-10
Overview:
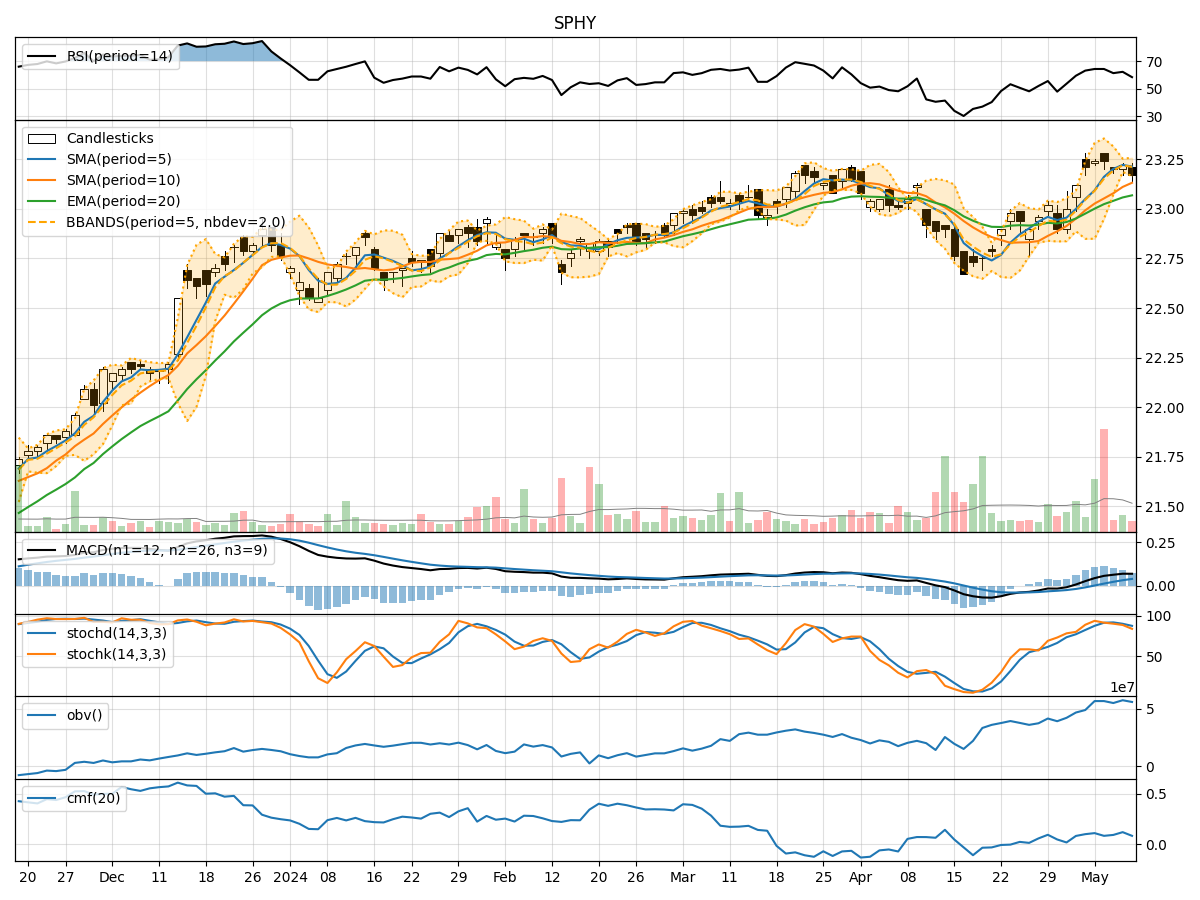
In analyzing the technical indicators for SPHY over the last 5 days, we will delve into the trend, momentum, volatility, and volume indicators to provide a comprehensive outlook on the possible stock price movement in the coming days. By examining these key indicators, we aim to offer valuable insights and predictions for potential investors.
Trend Indicators:
- Moving Averages (MA): The 5-day MA has been consistently above the 10-day SMA, indicating a short-term bullish trend. The EMA(20) has shown a slight upward trajectory, suggesting a positive momentum in the stock price.
- MACD: The MACD line has been above the signal line, with both lines showing an upward trend. The MACD histogram has been increasing, indicating strengthening bullish momentum.
Momentum Indicators:
- RSI: The RSI has been fluctuating around the 60-70 range, indicating a neutral to slightly bullish momentum.
- Stochastic Oscillator: Both %K and %D have been gradually decreasing, suggesting a potential reversal in momentum towards the oversold territory.
- Williams %R: The Williams %R has been consistently in the oversold region, indicating a bearish sentiment.
Volatility Indicators:
- Bollinger Bands: The stock price has been trading within the Bollinger Bands, with the bands narrowing, indicating decreasing volatility.
- Bollinger %B: The %B indicator has been hovering around the middle range, suggesting a neutral sentiment in terms of volatility.
Volume Indicators:
- On-Balance Volume (OBV): The OBV has shown mixed signals, with fluctuations in volume accumulation. This indicates indecision among market participants.
- Chaikin Money Flow (CMF): The CMF has been relatively stable around the zero line, indicating a balance between buying and selling pressure.
Key Observations:
- The trend indicators suggest a bullish sentiment in the short term, supported by the moving averages and MACD.
- Momentum indicators show a mixed picture, with RSI indicating a neutral stance, while stochastic and Williams %R signaling a potential bearish reversal.
- Volatility indicators point towards decreasing volatility, potentially leading to a period of consolidation.
- Volume indicators reflect indecision among investors, with OBV showing fluctuations and CMF hovering around the zero line.
Conclusion:
Based on the analysis of the technical indicators, the stock price of SPHY is likely to experience sideways movement in the coming days. The bullish trend indicated by moving averages and MACD may face resistance due to the bearish signals from momentum indicators like stochastic and Williams %R. The decreasing volatility and mixed volume signals further support the view of a consolidation phase. Investors should exercise caution and closely monitor key support and resistance levels for potential trading opportunities.
Recommendation:
- Short-term Traders: Consider taking profit at key resistance levels and closely monitor for potential reversal signals.
- Long-term Investors: Hold positions with a cautious approach, awaiting clearer signals from the technical indicators before making significant decisions.
By combining insights from trend, momentum, volatility, and volume indicators, investors can make informed decisions and navigate the market dynamics effectively.